
Apps, widgets, maps and charts, ready for your data
The 143 AI Data Components that RegiaBI Apps, Maps and Charts builds for you, in Power BI and in Excel. The complete ones come first: mini-apps with their controls inside the chart, and tables a reader works with. Each arrives built and tested, so you bind your data instead of wiring it up. Describe what you want, or let it pick what fits your data.
Why a gallery? Can't AI just build me anything I want?
To some degree, yes, but not done well. Our approach adds guardrails that help get quality outcomes.
Every component here has a designed, tested way of drawing it. The AI only offers one when your data fits it, and the code it writes is checked before you see the result, so what you get is a component that does its job.
Showing all 143
Complete, working solutions
Each one is a finished piece: the controls, the selection and the cross-filtering come built and tested, fitted to your table.
Mini-apps 10
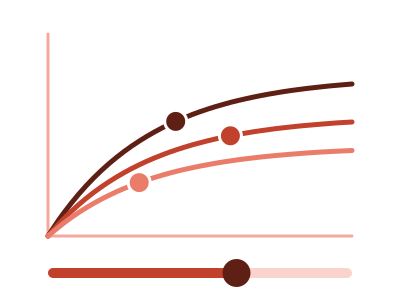
Budget allocator
Budget allocator: a fitted diminishing-returns curve per channel, a total you set, and the split where each channel's next dollar earns the same, with the cost of any other split
Works best with: One spend measure and one outcome by channel and period - monthly spend and signups for five marketing channels, budget and sales by region - with at least eight periods per channel
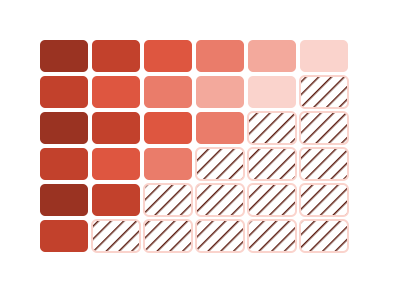
Cohort retention triangle
Cohort retention triangle: for the customers who joined in each period, the share still with us one, three, six and more months later, with the months nobody could have seen yet shown as not seen
Works best with: One row per customer with a start date and an end date that is blank while still a customer, over at least a year of starts
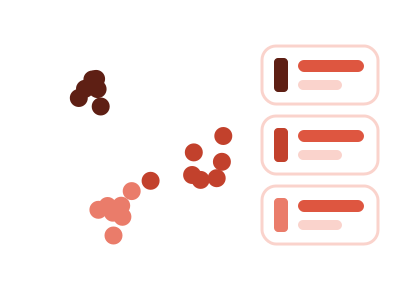
Customer segments
Customer segments: every customer as a dot, grouped by how recently they ordered, how often and how much they spend into segments the data chooses, each named and profiled, and any group you circle is compared with the rest
Works best with: One row per customer with days since the last order (or the last order date), a count of orders and a spend, ideally with other fields such as region or acquisition channel - at least a hundred customers
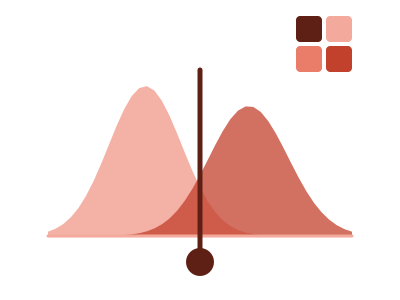
Cutoff tuner
Cutoff tuner: drag a cutoff along a score and see the right and wrong calls it makes against the real outcome - a live 2x2, the ROC or precision-recall curve, both score distributions, and the cheapest cutoff for the costs you type
Works best with: One row per case with a model score or rating and the actual yes/no outcome - churn, fraud, default, conversion - when the question is where to draw the line and what each choice costs
dataset Try it with Loan Default Predictors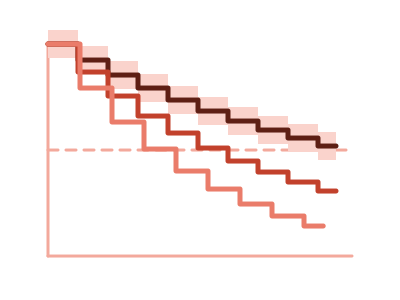
Retention curves
Retention curves: how long customers stay, one step curve per group with a band for how sure it is, the median lifetime of each and plain words on which gaps are real
Works best with: One row per customer with when they started and when they left (blank while still a customer), or their tenure and whether they left, plus a field to compare such as channel or plan - at least 30 customers
Selection explainer
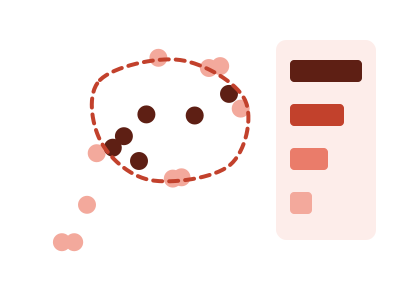
A scatter of two measures where you draw a lasso around a group of points and see which of your other fields set them apart from the rest - each with its share or median beside the rest's, tested against chance
Works best with: Two measures over thirty or more rows that also carry other fields - region, plan, tenure, size - when the question is 'what do these points have in common?'
dataset Try it with Customer Spend and Support TicketsIn Power BI, turn on Lasso Selection first (Format pane, Interaction): you draw this chart's selection with a lasso.
Territory planner
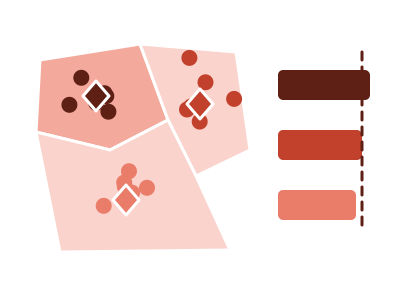
Territory planner: every account on a map of North America in its rep's color, territories redrawn so each rep's workload sits within a band you pick, locked accounts kept, with the accounts that change rep and a move-by-hand what-if
Works best with: One row per account with its location, its current rep and a workload measure - accounts by sales owner with yearly visit hours, stores by area manager - for 2 to 12 reps in North America
What-if predictor
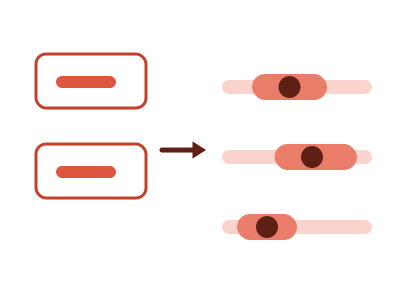
What-if predictor: type values for some of your measures and see the range every other measure is predicted to fall in - one linear model fitted on the rows in view, a prediction interval at 80, 90 or 95%, and the share of each measure's spread the values you typed explain
Works best with: Three to ten numeric measures over at least thirty rows that move together - stores, products, campaigns, regions by quarter - when the question is 'if these were X and Y, what would the others likely be?'; an ordered rating or size and one category of up to six values can be pinned too
dataset Try it with Real Estate Listings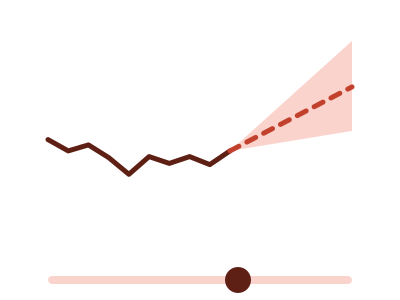
What-if projection
What-if projection: one measure over time, then a projected continuation the reader steers with an on-chart growth-rate slider and a horizon slider - the end value and the period a target is reached print beside the assumption, and a bound What-If parameter can own the rate instead
Works best with: A dated measure with at least six periods when the question is what happens next under an assumption the reader chooses - revenue against a target, headcount, subscribers; bind a What-If parameter measure to drive the rate from a slicer
dataset Try it with Divisional Revenue by Year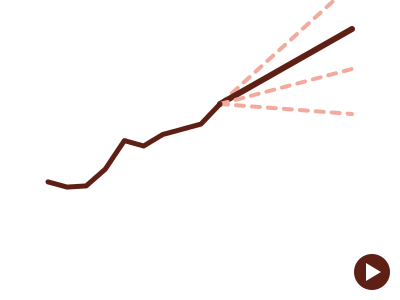
What-if scenarios
What-if scenarios: one measure over time, then its compound-growth projection at every scenario rate on one plot - the reader steps or plays through the scenarios and the emphasised projection glides to each, with the end value and the period a target is reached printed beside it; a bound What-If parameter column supplies the scenarios
Works best with: A dated measure with at least six periods when the question is how far apart the outcomes of several assumptions land - revenue under a range of growth rates, headcount, subscribers; bind a What-If parameter column to draw exactly the range you defined
dataset Try it with Divisional Revenue by YearTables 4

Churn risk list
Churn risk list: the active customers most likely to leave in the next 90 days, each with the reason, read from how long similar customers stayed
Works best with: One row per customer with a name or id, when they started and when they left (blank while active) - at least one active customer
Interactive table
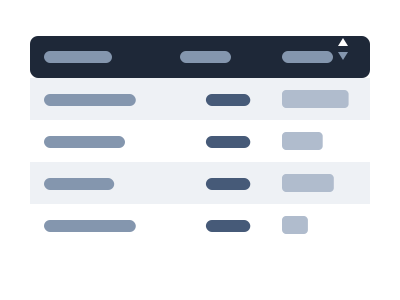
Interactive table: a table the reader works with - sort by any column, search the rows (from 10 rows: matches highlighted, or only the matching rows) and filter by column, drag column widths (a table wider than its tile scrolls sideways, with frozen columns and rows where asked), copy a cell or a block of cells out, show or hide columns, page through long lists, and open a hover window for the detail behind a short value, and it keeps each reader's sort, column widths and hidden columns; its cells print as numbers, dates, text, yes/no ticks, small images and links that open where the app allows (aligned and formatted, banded rows, a total when asked) and draw a mark only where a column asks for one: a data bar, a pin, a status chip, an icon, or one value printed with comparison bars against several others
Works best with: Any set of rows and columns that a reader wants to scan, sort and look into - an account list, a roster, a task or ticket list, a ledger, results with a status and a score; long lists a chart would crowd
dataset Try it with Household Expense Breakdown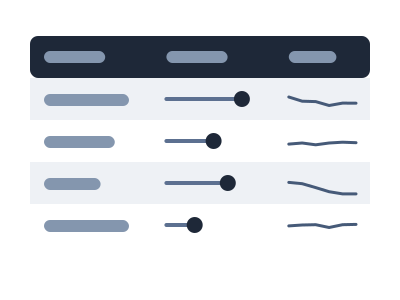
Table with embedded
Table with embedded: a tabular layout where every cell DRAWS its value - small bars, dots, range marks or value cards - so you can scan down a column and see the outliers without reading numbers; one row per item (formerly Tabular with embedded)
Works best with: Best for a small set of items compared across several attributes at once (a forecast/roster/scorecard table)
dataset Try it with Support Cost by Team, Year over Year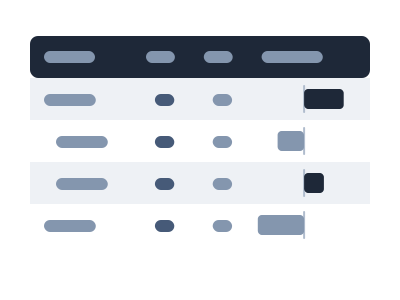
Variance grid
Variance grid: an interactive table whose rows are the data's own structure (accounts, units, regions - one level or nested), with the ACTUAL, the BUDGET, PLAN or TARGET the data names, and the absolute and percentage variance drawn as bars and pins in aligned columns; subtotals per group, a footer total, sort, expand and collapse, a pager and a column picker
Works best with: One or more category columns plus two measures where one names itself the reference - Revenue and Revenue Budget, Cost and Cost Plan, Attained and Quota; a P&L, a budget review, plan attainment by unit; many rows or nested groups that a chart would crowd
dataset Try it with Department Budget vs ActualMaps 30

Africa (Bubbles)
Africa (Bubbles): each row plotted as a bubble on a map of Africa - positioned by its latitude/longitude, or by its province, city or country when it has none - with bubble size encoding one measure and color a second measure or a category
Works best with: Best for point, city, province or country data within Africa: stores, offices, customers or revenue by place, with a measure for bubble size and optionally a second measure or category for color

Africa Choropleth
Africa Choropleth: the countries of Africa shaded by a measure on a filled map framed on Africa, a closer view than the world map when the data sits in one continent
Works best with: Best for country-level metrics when the countries are in Africa: sales, users, or population by country (keyed to country names or ISO codes)

Africa Choropleth (by province)
Africa Choropleth (by province): the provinces, states and regions of Africa shaded by a measure, from a province column or from cities that roll up to their province
Works best with: Best for metrics by province, state or region in Africa, or by city when you want the cities summed into their provinces (keyed to province names, ISO codes or city names)
Animated World (Bubbles)
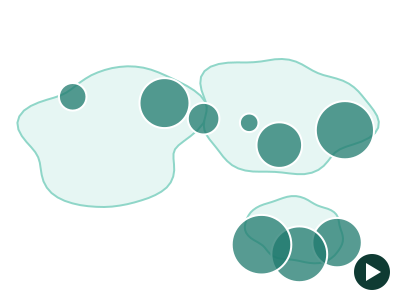
Animated World (Bubbles): one bubble per place on a world basemap, positioned by coordinates or by country, whose size and color animate period by period with play/pause and a scrubber - the place never moves, its measure does
Works best with: Best for a measure per place observed at 3 or more ordered time points - revenue by country by year, openings by city by quarter, throughput by port by month - when the question is how each place changed rather than where it ranks
dataset Try it with Store Revenue by Country, 15 Years
Animated World Choropleth
Animated World Choropleth: a filled world map whose country shading animates across an ordered time dimension, revealing how a measure shifts across countries period by period
Works best with: Best for a country-level measure observed at 3 or more ordered time points — watch how sales, users, or population shift across countries year by year
dataset Try it with Global Revenue Expansion — 20 Years of Country Rollout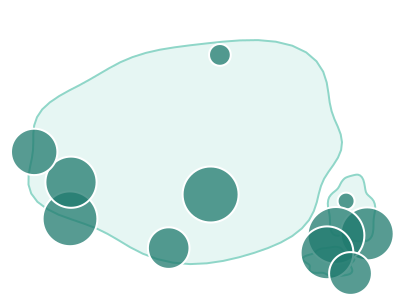
Asia (Bubbles)
Asia (Bubbles): each row plotted as a bubble on a map of Asia - positioned by its latitude/longitude, or by its province, city or country when it has none - with bubble size encoding one measure and color a second measure or a category
Works best with: Best for point, city, province or country data within Asia: stores, offices, customers or revenue by place, with a measure for bubble size and optionally a second measure or category for color

Asia Choropleth
Asia Choropleth: the countries of Asia shaded by a measure on a filled map framed on Asia, a closer view than the world map when the data sits in one continent
Works best with: Best for country-level metrics when the countries are in Asia: sales, users, or population by country (keyed to country names or ISO codes)

Asia Choropleth (by province)
Asia Choropleth (by province): the provinces, states and regions of Asia shaded by a measure, from a province column or from cities that roll up to their province
Works best with: Best for metrics by province, state or region in Asia, or by city when you want the cities summed into their provinces (keyed to province names, ISO codes or city names)
dataset Try it with Ocean Shipping Container ManifestNot in apps built through the MCP server, which doesn't draw province maps.

Bivariate USA Choropleth (by state)
Bivariate USA Choropleth (by state): US states colored by TWO measures at once on a filled Albers-USA map - a 3x3 color matrix of thirds, so where the two measures disagree is visible in one look
Works best with: Best for two state-level measures that might disagree: revenue vs return rate, income vs cost of living, cases vs vaccinations - at least 24 states and two measures that do not simply track each other
dataset Try it with US State Store Metrics
Bivariate World Choropleth
Bivariate World Choropleth: countries colored by TWO measures at once on a filled world map - a 3x3 color matrix of thirds, so where the two measures disagree is visible in one look
Works best with: Best for two country-level measures that might disagree: wealth vs inequality, revenue vs margin, cases vs deaths - at least 24 countries and two measures that do not simply track each other
dataset Try it with Country Development Indicators (Illustrative)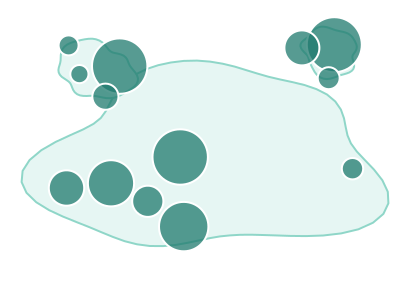
Europe (Bubbles)
Europe (Bubbles): each row plotted as a bubble on a map of Europe - positioned by its latitude/longitude, or by its province, city or country when it has none - with bubble size encoding one measure and color a second measure or a category
Works best with: Best for point, city, province or country data within Europe: stores, offices, customers or revenue by place, with a measure for bubble size and optionally a second measure or category for color

Europe Choropleth
Europe Choropleth: the countries of Europe shaded by a measure on a filled map framed on Europe, a closer view than the world map when the data sits in one continent
Works best with: Best for country-level metrics when the countries are in Europe: sales, users, or population by country (keyed to country names or ISO codes)

Europe Choropleth (by province)
Europe Choropleth (by province): the provinces, states and regions of Europe shaded by a measure, from a province column or from cities that roll up to their province
Works best with: Best for metrics by province, state or region in Europe, or by city when you want the cities summed into their provinces (keyed to province names, ISO codes or city names)

Middle East Choropleth
Middle East Choropleth: the countries of the Middle East shaded by a measure on a filled map framed on the Middle East, a closer view than the world map when the data sits in the Middle East
Works best with: Best for country-level metrics when the countries are in the Middle East: sales, users, or population by country (keyed to country names or ISO codes)

North America (Bubbles)
North America (Bubbles): each row plotted as a bubble at its latitude/longitude coordinates on a North America basemap - bubble size encodes one measure, bubble color a second measure or a category
Works best with: Best for point-located data with latitude and longitude columns: stores, cities, facilities, or events across North America, with a measure for bubble size and optionally a second measure or category for color
dataset Try it with North America City Metrics — 21 Cities with Coordinates
North America Choropleth
North America Choropleth: the countries of North America shaded by a measure on a filled map framed on North America, a closer view than the world map when the data sits in one continent
Works best with: Best for country-level metrics when the countries are in North America: sales, users, or population by country (keyed to country names or ISO codes)

North America Choropleth (by province)
North America Choropleth (by province): the provinces, states and regions of North America shaded by a measure, from a province column or from cities that roll up to their province
Works best with: Best for metrics by province, state or region in North America, or by city when you want the cities summed into their provinces (keyed to province names, ISO codes or city names)
dataset Try it with North America City Metrics — 21 Cities with CoordinatesNot in apps built through the MCP server, which doesn't draw province maps.

Oceania (Bubbles)
Oceania (Bubbles): each row plotted as a bubble on a map of Oceania - positioned by its latitude/longitude, or by its province, city or country when it has none - with bubble size encoding one measure and color a second measure or a category
Works best with: Best for point, city, province or country data within Oceania: stores, offices, customers or revenue by place, with a measure for bubble size and optionally a second measure or category for color

Oceania Choropleth
Oceania Choropleth: the countries of Oceania shaded by a measure on a filled map framed on Oceania, a closer view than the world map when the data sits in one continent
Works best with: Best for country-level metrics when the countries are in Oceania: sales, users, or population by country (keyed to country names or ISO codes)

Oceania Choropleth (by province)
Oceania Choropleth (by province): the provinces, states and regions of Oceania shaded by a measure, from a province column or from cities that roll up to their province
Works best with: Best for metrics by province, state or region in Oceania, or by city when you want the cities summed into their provinces (keyed to province names, ISO codes or city names)
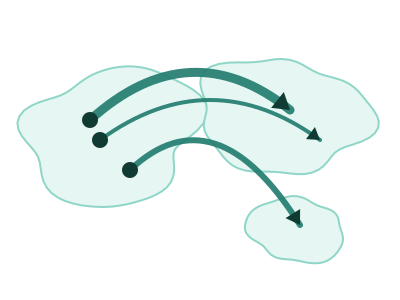
Origin-Destination Flow Map
Origin-Destination Flow Map: each route drawn as a great-circle arc from its origin to its destination on a world basemap, with arc width encoding the size of the flow and a light-to-dark gradient showing which way it runs
Works best with: Best for movement between places: flight routes, shipping and trade lanes, migration, commutes or transfers, where each row names where something started and where it ended plus a measure of how much moved

South America (Bubbles)
South America (Bubbles): each row plotted as a bubble on a map of South America - positioned by its latitude/longitude, or by its province, city or country when it has none - with bubble size encoding one measure and color a second measure or a category
Works best with: Best for point, city, province or country data within South America: stores, offices, customers or revenue by place, with a measure for bubble size and optionally a second measure or category for color

South America Choropleth
South America Choropleth: the countries of South America shaded by a measure on a filled map framed on South America, a closer view than the world map when the data sits in one continent
Works best with: Best for country-level metrics when the countries are in South America: sales, users, or population by country (keyed to country names or ISO codes)

South America Choropleth (by province)
South America Choropleth (by province): the provinces, states and regions of South America shaded by a measure, from a province column or from cities that roll up to their province
Works best with: Best for metrics by province, state or region in South America, or by city when you want the cities summed into their provinces (keyed to province names, ISO codes or city names)

US hex-tile cartogram
Every US state drawn as one equal hexagon in a grid, so each state carries the same visual weight regardless of its real size
Works best with: Best with one row per US state and a single measure, when the question is which states are high or low rather than where they are
dataset Try it with COVID Cases & Hospitalizations by State
USA Choropleth (by state)
USA Choropleth (by state): US states shaded by a measure on a filled Albers-USA map, revealing state-level geographic patterns
Works best with: Best for state-level US metrics: sales, users, or population by state, any measure that varies by US state (keyed to state names or USPS codes)
dataset Try it with U.S. Orders by ZIP Code
USA Choropleth (by ZIP-3)
USA Choropleth (by ZIP-3): three-digit ZIP prefix regions shaded by a measure on a filled US map - 5-digit ZIPs are grouped into their ~900 three-digit prefix areas (e.g. 90210 into region 902), revealing regional postal patterns (this is a REGIONAL zip map, not one polygon per 5-digit ZIP)
Works best with: Best for regional US ZIP analysis: metrics by 3-digit ZIP prefix area, any measure that varies across US postal regions (keyed to 5-digit ZIP codes, grouped to their 3-digit prefix)
dataset Try it with U.S. Orders by ZIP Code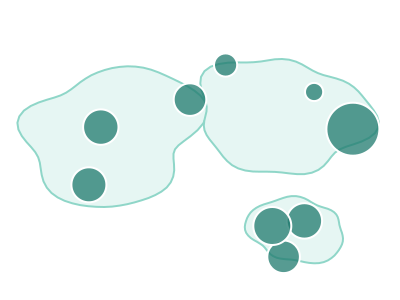
World (Bubbles)
World (Bubbles): each row plotted as a bubble on a world basemap - positioned by its latitude/longitude when the data has them, or by its COUNTRY when it does not - with bubble size encoding one measure and color a second measure or a category
Works best with: Best for point or country-level data spanning more than one continent: offices, shipments, users or revenue by country, with a measure for bubble size and optionally a second measure or category for color
dataset Try it with Earthquake Locations & Magnitude
World Choropleth
World Choropleth: countries shaded by a measure on a filled world map, revealing geographic and regional patterns across the globe
Works best with: Best for country-level metrics: sales, users, or population by country, any measure that varies by nation (keyed to country names or ISO codes)
dataset Try it with World City Sales — 117 Cities Across 55 Countries
World tile-grid cartogram
Every country drawn as one equal square in a grid, so a small country carries the same visual weight as a large one
Works best with: Best with one row per country and a single measure, when the question is which countries are high or low rather than where they are
dataset Try it with Business Locations DirectoryKPIs & cards 12
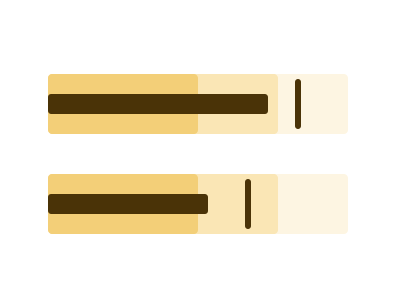
Bullet chart
A compact KPI bar showing a measure against a target marker and qualitative range bands (e.g. poor/satisfactory/good), packing actual-vs-target-vs-context into one small row
Works best with: Best for actual-vs-target KPIs with thresholds (revenue vs goal, SLA vs target) — a denser, clearer replacement for gauges
dataset Try it with Team Quota Attainment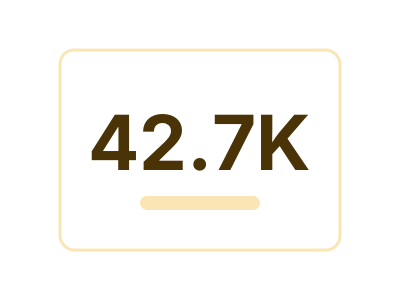
Card
A single headline number, optionally with a small label or sub-text underneath. The dataset is summarized to ONE value (sum / mean / count / max / latest) and rendered large enough to read at a glance — ideal for KPI tiles and very small viewports where a richer chart would be illegible
Works best with: One numeric value that summarizes the dataset; small viewports
dataset Try it with Support Cost by Team, Year over Year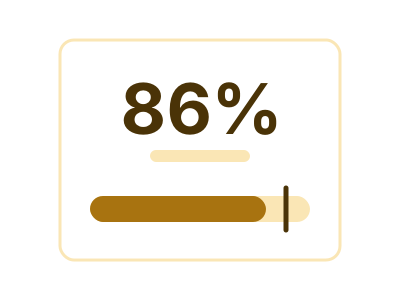
Card with embedded
Card with embedded: a headline number with one small drawing inside the card carrying one more channel - against its target, over time, across comparable measures, split by a small category, or spread across a large one - the form chosen to fit the data and the tile
Works best with: One headline value that deserves one more channel beside it: attainment with its target, a metric with its history, a profile of a few comparable scores, or a total with its split across up to eight categories; small tiles
dataset Try it with Support Cost by Team, Year over Year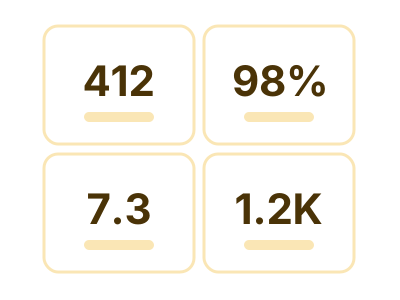
Card with multiple KPI
A grid (or stack) of N labeled value tiles, each showing one headline number derived from a distinct numeric column. Ideal for dashboards that need to surface several independent metrics at once on a small tile — Revenue / Users / Conversion / etc. — and especially well-suited to long-narrow or short-wide viewports where stacking N small cards reads far better than a single stretched chart
Works best with: Multiple independent numeric metrics that should be surfaced together; KPI dashboards; long-narrow / short-wide viewports
dataset Try it with KPI Attainment vs Target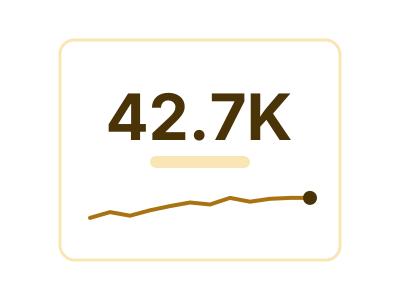
Card with sparkline
A headline number paired with a tiny inline trendline (sparkline) that shows recent history of that value. Combines the at-a-glance readability of a Card with a compact visual of how the metric is trending — ideal for KPI tiles in small viewports
Works best with: One numeric metric trending over an ordered dimension; small viewports
dataset Try it with Divisional Revenue by Year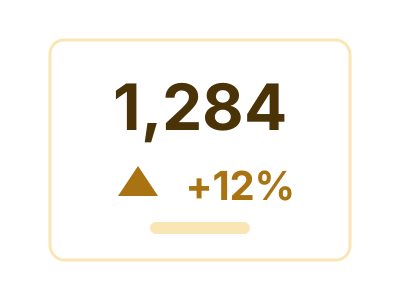
Delta KPI
One headline number beside the value it is being compared with, and the change between them stated twice - as an amount and as a percentage - with the direction shown but colored only when the data says which way is better
Works best with: Two comparable measures, or one measure at two points in time - this period against last, actual against plan, after against before
dataset Try it with Support Cost by Team, Year over Year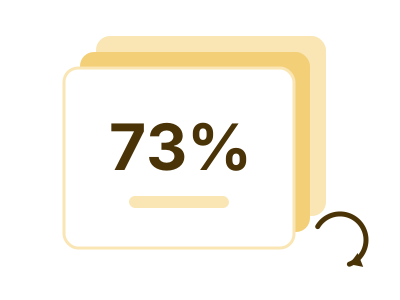
Flippable multi-card
Flippable multi-card: a set of KPI panels that page through a shared carousel of faces - the category's values when a dimension is bound, the measures themselves when not - opening on the face that most deserves attention
Works best with: Best when more headline numbers compete for one tile than fit at once: several measures side by side, or one or two measures paged through a small category, with the details on hover
dataset Try it with Support Cost by Team, Year over Year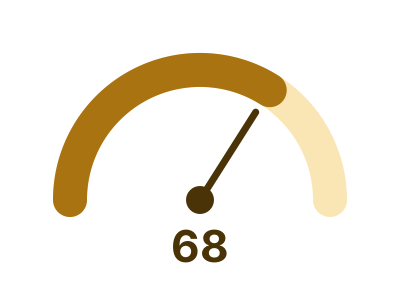
Gauge
A radial arc showing a value against a maximum the data or the user stated, with the number printed large at the center and an optional target tick on the arc - one dial per value of a bound category, all on one shared scale and every dial drawn or counted, and one dial when nothing splits the rows; a value that is the same on every row is a valid reading
Works best with: A value against a ceiling the data states - a percentage, a rate, or a measure that has a target - overall or one dial per category; a constant value is a valid reading
dataset Try it with Team Quota Attainment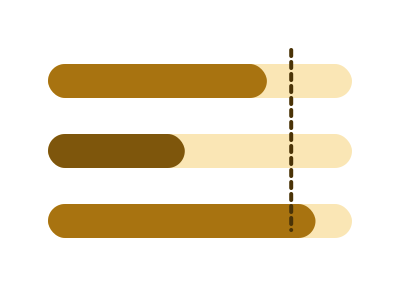
Linear gauge
A horizontal track with a filled portion showing a value against a stated maximum, the unfilled remainder making the ceiling visible - one track per value of a bound category, stacked on one shared scale with every row drawn or counted; the form that stays readable in a short, wide tile, and a value that is the same on every row is a valid reading
Works best with: A value against a ceiling the data states, overall or one track per category, in a short wide tile - percent complete, utilisation, progress to a target; a constant value is a valid reading
dataset Try it with Revenue Mix by Account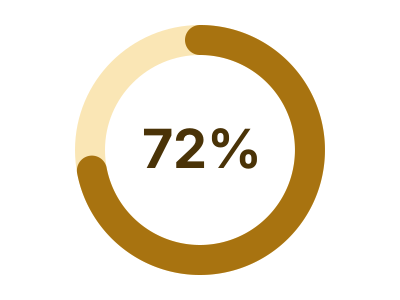
Progress ring
An arc sweeping a full circle to show a value as a fraction of a stated ceiling, with the percentage in the middle - one ring per value of a bound category, each against its own ceiling, every ring drawn or counted; the KPI form that survives a small square tile, and a value that is the same on every row (a rate that is always 100%) is a valid reading
Works best with: A value against a ceiling the data states, overall or one ring per category, in a small or square tile - percent complete, attainment, utilisation; a constant value is a valid reading
dataset Try it with Department Budget vs Actual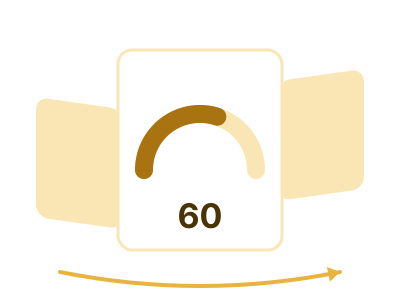
Rotating carousel
Rotating carousel: ONE sub-chart - a gauge, a line, a bar, a donut, a waffle or a radar - turning through a category's values on a 3D ring, the previous and next values peeking at each side
Works best with: Best when each category value deserves its own small chart and the tile has room for only one at a time; the reader turns it, or it turns itself
dataset Try it with Household Expense Breakdown
Thermometer
A vertical bounded tube filled from a bulb at the base, with the value at the fill head and a target mark across the track - one tube per value of a bound category, each against its own goal when the goal is a column, every tube drawn or counted; the bounded form that WANTS a tall narrow tile, and a value that is the same on every row is a valid reading
Works best with: A value against a ceiling the data states, overall or one tube per category, in a tall narrow tile - a sidebar rail or a column of KPIs down a page edge; a constant value is a valid reading
ChartsComparison & ranking 17
Bar chart (horizontal)
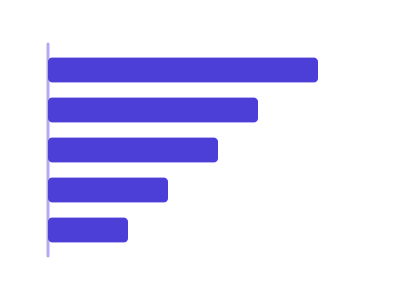
Horizontal bars; useful for long category names
Works best with: Requires one categorical and one numeric variable
dataset Try it with Airline Flight Delays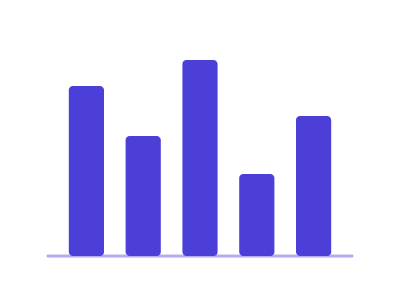
Bar chart (vertical)
Vertical bars; good for categorical vs numeric values
Works best with: Requires one categorical and one numeric variable
dataset Try it with North America City Metrics — 21 Cities with Coordinates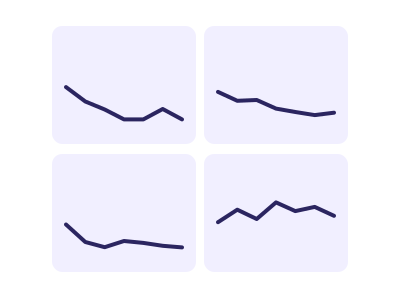
Custom small multiples
Repeats the same chart across facets for categorical comparison
Works best with: Best when comparing patterns across categories
dataset Try it with Store Revenue by Country, 15 Years
Dumbbell chart
Shows change between two numeric values per category using connected points
Works best with: Best for before/after or comparison scenarios
dataset Try it with Support Cost by Team, Year over Year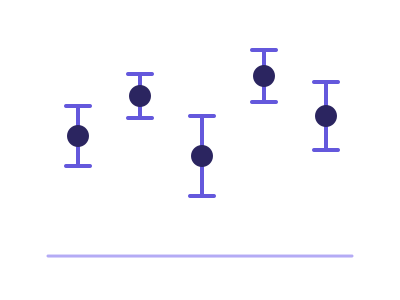
Error bar plot
Plot with error bars for uncertainty in measurements
Works best with: Requires a category and a measure with a spread to show - repeated rows per category or a second measure holding the error
dataset Try it with Order Value by Store, Raw Order Rows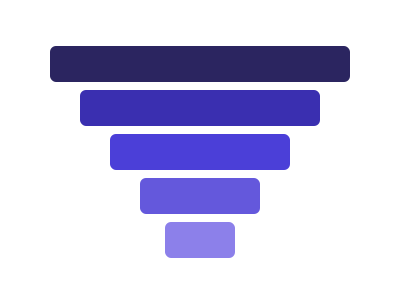
Funnel chart
Ordered, tapering horizontal bars showing how a quantity drops off from one sequential stage to the next, with each stage's width encoding its value and the narrowing communicating conversion/attrition
Works best with: Best for conversion/attrition pipelines: signup funnels, sales pipeline stages, checkout flow drop-off
dataset Try it with Department Budget vs Actual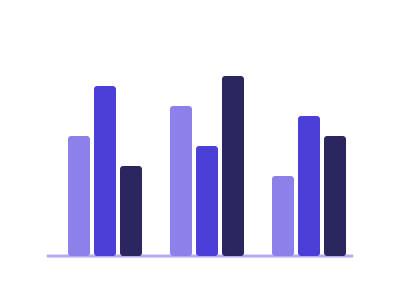
Grouped bar chart
Grouped bars to compare subcategories across categories
Works best with: Requires one categorical, one subcategory, and one numeric variable
dataset Try it with Product Release Timeline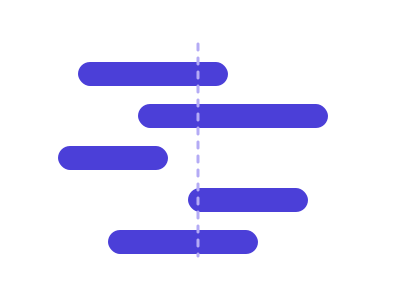
Horizontal/vertical span plot
Span plot drawing each category's low-to-high or start-to-end interval as a floating bar on one shared axis
Works best with: Requires a category and two numeric bounds per category - a low and a high, or a start and an end - on one shared scale
dataset Try it with Daily Stock Prices (OHLCV)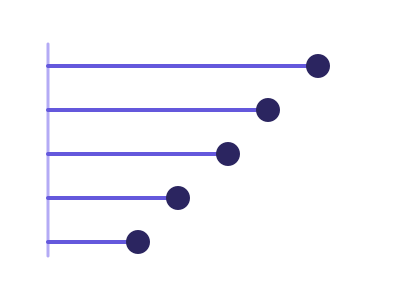
Lollipop chart
A cleaner alternative to a bar chart: a thin stem from the baseline to a dot that marks each category's value, reducing ink and clutter when ranking many categories
Works best with: Best as a cleaner bar replacement for ranking many categories by a single measure
dataset Try it with Support Cost by Team, Year over Year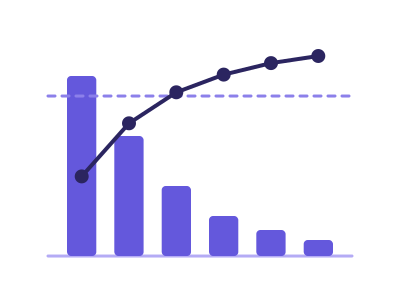
Pareto chart
Pareto chart: categories ranked descending as bars with a cumulative-percentage line on a secondary axis and an 80% reference, exposing the vital few causes behind most of the effect
Works best with: Best for finding the vital few: defect/complaint/incident counts by cause, revenue concentration by product or customer (the 80/20 view)
dataset Try it with Order Value by Store, Raw Order Rows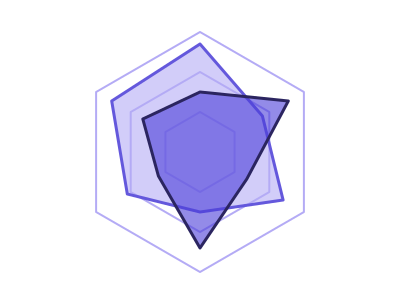
Radar (spider) chart
Radar chart comparing multiple continuous variables across categories
Works best with: Requires multiple continuous variables across categories
dataset Try it with North America City Metrics — 21 Cities with Coordinates
Rose (Coxcomb) chart
Rose (Coxcomb) chart: categories placed around a circle with each sector's RADIUS encoding its magnitude, the polar counterpart of a bar chart and the natural reading for directional or cyclical categories
Works best with: Best for cyclical or directional categories: wind direction, hour of day, month of year, compass sectors - anywhere the categories wrap around rather than running left to right
dataset Try it with Solar Panel Energy Output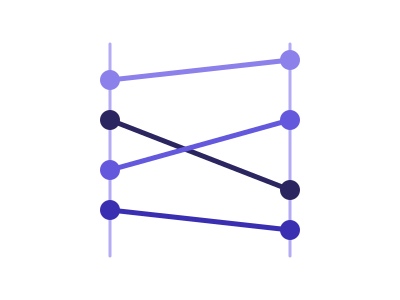
Slope chart
Connects each series' value at two points with a straight line, so the slope's direction and steepness encode the magnitude of change between them
Works best with: Best for two-period change across many categories: YoY by region/segment, before/after comparisons, ranking shifts between two snapshots
dataset Try it with Urban Air-Quality Monitoring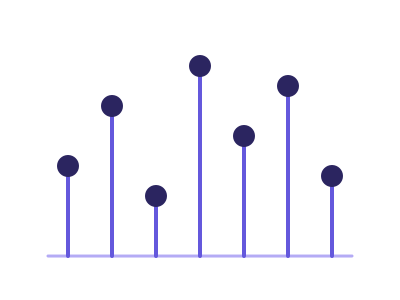
Stem plot
Stem plot showing each value as a stem from a baseline along an ordered sequence of discrete samples
Works best with: Requires one measure read along an ordered sequence - a time step, a row index or an ordered category
dataset Try it with Fitness Tracker — Daily Steps, Sleep & Heart Rate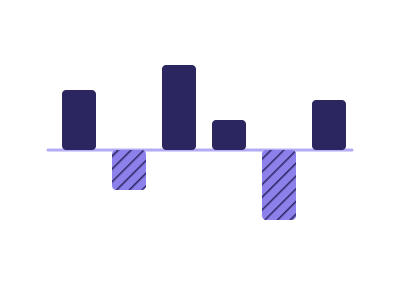
Variance chart (budget vs actual)
Variance chart: for every period or unit the ACTUAL against a BUDGET, PLAN or TARGET the data names, with the difference drawn as its own marks - absolute variance bars and percentage pins under solid-vs-hollow value bars, or a shaded difference between two lines over a long time axis
Works best with: One category or period column plus two measures where one names itself the reference - Revenue and Revenue Budget, Cost and Cost Plan, Attained and Quota; finance reporting, budget reviews, plan attainment
dataset Try it with Team Quota Attainment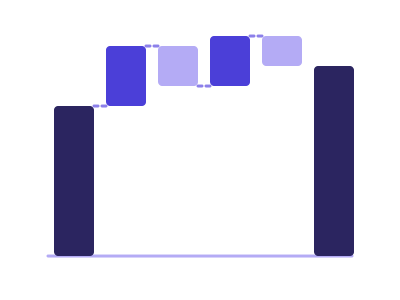
Waterfall chart
Shows cumulative effect of sequential positive and negative values, with floating bars connecting to running total
Works best with: Best for financial data showing contribution to total (revenue bridges, P&L analysis, budget variance)
dataset Try it with City 311 Service Complaints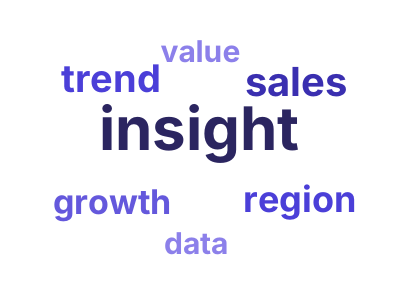
Word cloud
Text visualization where word size is proportional to frequency or importance score
Works best with: Requires text data or pre-computed word-frequency pairs; best for qualitative text exploration
dataset Try it with NBA Player Season StatsChartsOver time 21
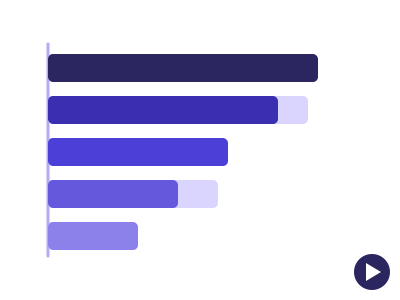
Animated bar chart
Horizontal bar chart played over an ordered time dimension - bars re-rank and slide period by period, the classic 'bar chart race'
Works best with: Requires one categorical, one measure and a time column with 5 or more ordered periods; best for a leaderboard that changes over time (top products by year, teams by season, countries by decade)
dataset Try it with SaaS Subscription Metrics by Plan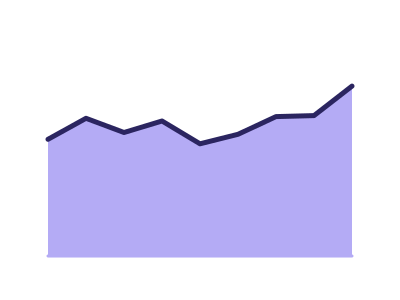
Area chart
Area chart to show magnitude over time or another ordered axis, one filled region per series
Works best with: Requires ordered categories or time with a continuous variable
dataset Try it with Monthly Signups with a Target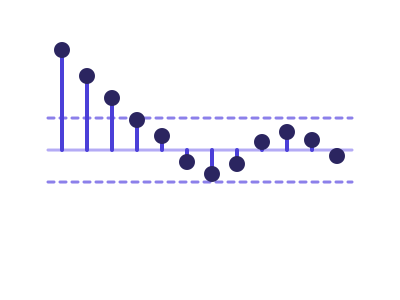
Autocorrelation plot
Autocorrelation (ACF) correlogram for time series lag-structure analysis, with the partial autocorrelation (PACF) where the renderer computes it
Works best with: Requires a datetime series with one continuous variable
dataset Try it with Global Revenue Expansion — 20 Years of Country Rollout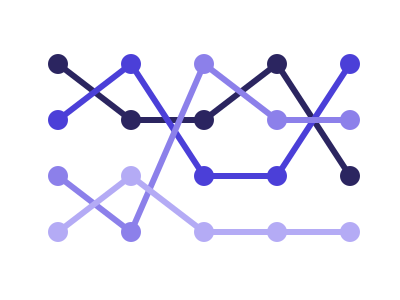
Bump chart
Plots each series' RANK (not raw value) across ordered time points, with crossing lines showing how positions rise and fall over time
Works best with: Best for leaderboard/position dynamics: how a handful of regions, products, or teams change rank quarter to quarter
dataset Try it with Divisional Revenue by Year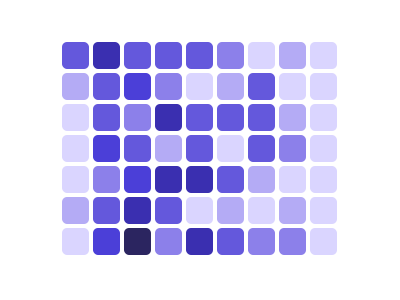
Calendar heatmap
GitHub-style grid showing daily values arranged in week/month calendar format with color intensity
Works best with: Requires daily datetime data with associated numeric values; best for activity/contribution tracking over time
dataset Try it with Fitness Tracker — Daily Steps, Sleep & Heart Rate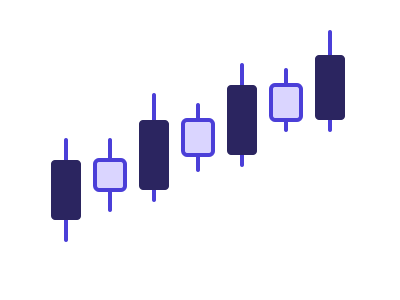
Candlestick chart
Financial chart showing open, high, low, and close values over time
Works best with: Best for financial or trading data
dataset Try it with Daily Stock Prices (OHLCV)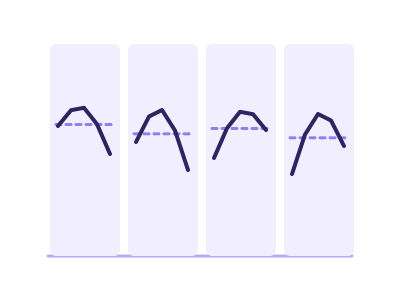
Cycle plot
Splits a time series into one mini-panel per seasonal sub-period (e.g. a small line for each quarter across years), so within-period trend and across-period seasonality are both visible at once
Works best with: Best for multi-year monthly/quarterly/weekly data where the question is seasonality vs trend ('is Q4 always highest, and is each Q4 growing?')
dataset Try it with Fitness Tracker — Daily Steps, Sleep & Heart Rate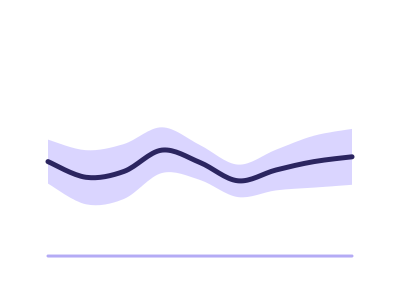
Error band
Error band: a measured central line with a shaded band showing spread (confidence interval, standard deviation or min-max) around it along a continuous or temporal axis
Works best with: Best for repeated measurements over time or over a continuous axis: latency trials, sensor readings, A/B metrics - anywhere the SPREAD matters as much as the average
dataset Try it with Divisional Revenue by Year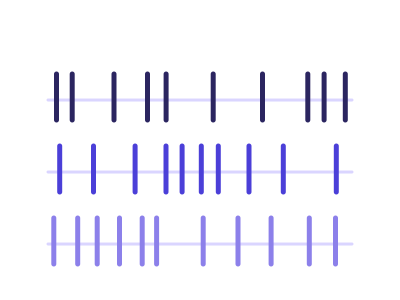
Event plot
Event plot to show occurrence times of events
Works best with: Requires a date or ordered value for each event, with an optional category that splits the events into lanes
dataset Try it with Divisional Revenue by Year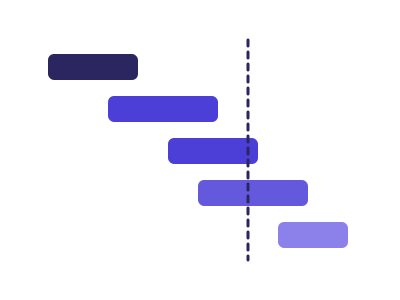
Gantt chart
Gantt chart: one horizontal bar per task spanning its start and end dates on a time axis, grouped by phase, showing schedule and overlap at a glance
Works best with: Best for project and phase schedules: tasks with a start and an end date, optionally grouped by phase, workstream or owner
dataset Try it with Ocean Shipping Container Manifest
Horizon chart
Compact time series visualization using layered bands to show magnitude
Works best with: Best for dense time series dashboards
dataset Try it with Divisional Revenue by YearIn Power BI it needs a tile at least 800 px wide and 560 px tall.
Lag plot (scatter of value vs lag)
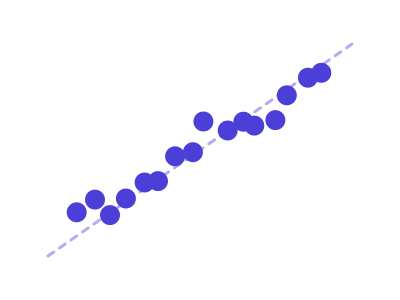
Lag plot for autocorrelation of time series
Works best with: Requires a datetime series with one continuous variable
dataset Try it with Solar Panel Energy Output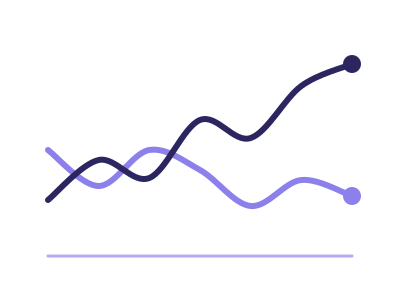
Line chart
Use a line chart for one or more continuous series over ordered categories; multiple measures or a series category yield multiple lines
Works best with: One or more continuous series over an ordered/temporal axis
dataset Try it with Monthly Signups with a Target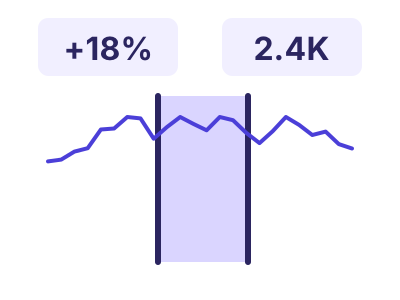
Range-compare time series
Range-compare time series: one measure over time with two draggable range handles, and a strip of KPI tiles above that recompute live for the selected window - its total, the value at each handle, and the percent change between them
Works best with: Best for a single measure tracked over many dates when the story is a chosen window: drag the two handles to total a period and compare its endpoints, like revenue across a campaign or sensor readings around an incident
dataset Try it with Urban Air-Quality Monitoring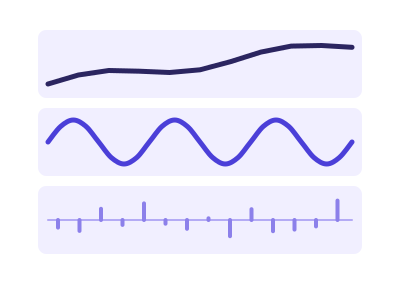
Seasonal decomposition
Splits one time series into trend, seasonal and residual components in aligned stacked panels
Works best with: Requires a datetime series with one continuous variable and at least two full seasonal cycles
dataset Try it with Retail Store Daily Sales (2 Years)Not in Excel: the add-in draws with D3, and this chart type has no D3 version.

Spiral plot
Wraps a long time series around an Archimedean spiral so each full loop is one period (year/week), making periodic and seasonal patterns visually pop
Works best with: Best for long, finely-grained, strongly periodic series (years of daily data) where the cyclic pattern is the story
dataset Try it with COVID Cases & Hospitalizations by State
Stacked area chart
Stacked area chart to show multiple continuous series over categories
Works best with: Requires ordered categories with multiple continuous series
dataset Try it with Ride-Hailing Demand by Hour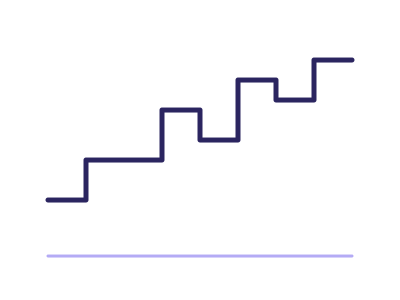
Step plot
Step plot for discrete changes over ordered categories
Works best with: Requires ordered categories with one continuous variable
dataset Try it with Fitness Tracker — Daily Steps, Sleep & Heart Rate
Streamgraph
Smooth, organic stacked-area variant centered on a baseline that flexes around zero, used to compare flows of multiple categorical series over time
Works best with: Best with 3-12 categorical series and a continuous time axis with at least 15-30 evenly-spaced points
dataset Try it with Urban Air-Quality Monitoring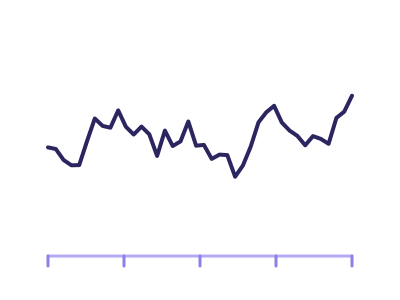
Time series plot
Time series plot: continuous data over datetime
Works best with: Requires a datetime axis with at least one continuous variable
dataset Try it with Fitness Tracker — Daily Steps, Sleep & Heart Rate
Trail
Trail: a line over time whose THICKNESS varies to encode a second measure, showing a trajectory and its magnitude together in one mark
Works best with: Best when a series has both a level and a weight: price with traded volume, sentiment with mention count, a metric with the sample size behind it
dataset Try it with Fitness Tracker — Daily Steps, Sleep & Heart RateChartsDistribution 12

Beeswarm chart
Displays distributions of a numeric variable across categories, one dot per observation packed sideways so no two overlap
Works best with: Best for showing distribution density across small categorical sets
dataset Try it with NBA Player Season Stats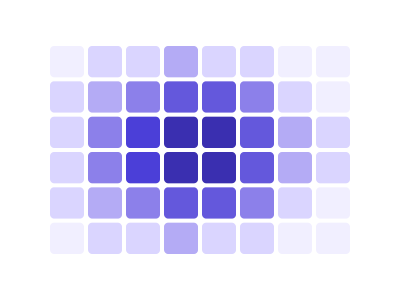
Binned 2D heatmap
Binned 2D heatmap: two continuous variables binned into a rectangular grid with cell color encoding the count or an aggregate, revealing density where individual points would overplot
Works best with: Best for dense scatter data where points overplot: thousands of observations of two continuous variables, where the question is where the mass is rather than where each point is
dataset Try it with Earthquake Locations & Magnitude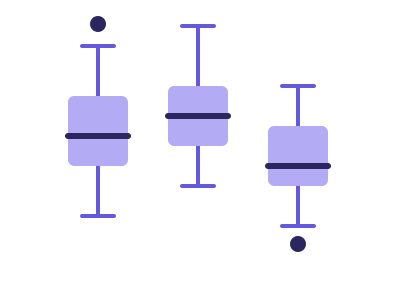
Box plot
Box plot showing distribution and outliers of a continuous variable
Works best with: Requires one continuous variable (plus optional category)
dataset Try it with NBA Shot Locations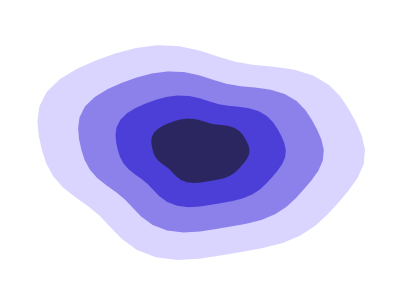
Density contour plot
Contour plot for density estimation of two continuous variables
Works best with: Requires two continuous variables
dataset Try it with City 311 Service Complaints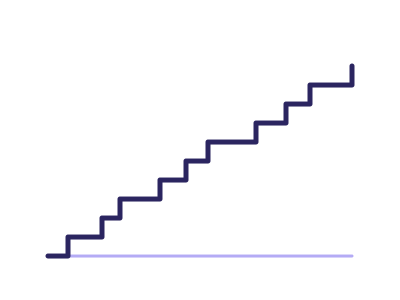
ECDF plot
Empirical cumulative distribution function plot
Works best with: Requires one continuous variable
dataset Try it with NBA Player Season Stats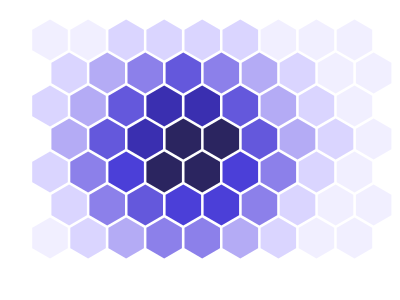
Hexbin plot
Hexbin plot for density of two continuous variables
Works best with: Requires two continuous variables
dataset Try it with City 311 Service Complaints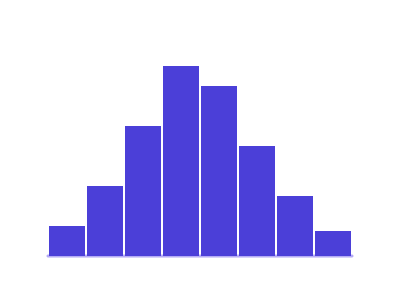
Histogram
Histogram of a continuous variable
Works best with: Requires one continuous variable
dataset Try it with NBA Player Season Stats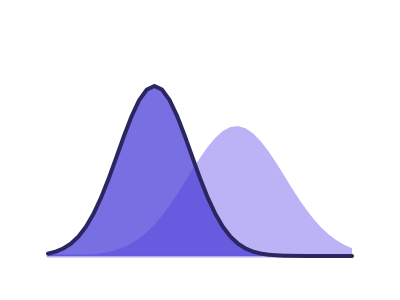
KDE plot (1D & 2D)
Kernel density estimate plot
Works best with: Requires one continuous variable (or two for 2D KDE)
dataset Try it with NBA Player Season Stats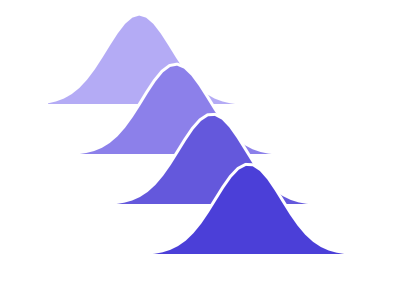
Ridgeline plots
Overlapping density plots stacked vertically to compare distributions
Works best with: Best with many observations per category
dataset Try it with NBA Player Season Stats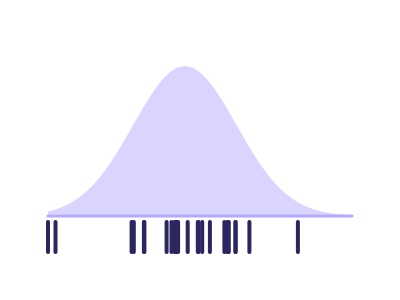
Rug plot
Rug plot to show individual data points along an axis
Works best with: Requires one continuous variable
dataset Try it with NBA Player Season Stats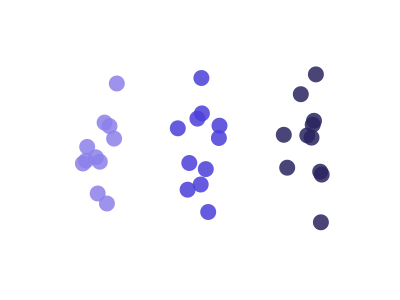
Strip plot
Strip / jitter plot — categorical groups on one axis, continuous values on the other, with a small random horizontal offset on the category axis to spread overlapping points
Works best with: Requires one categorical and one continuous variable; jitter on the category axis prevents overplot at the same value
dataset Try it with Wine Chemistry & Ratings
Violin plot
Violin plot showing distribution of continuous variable with density
Works best with: Requires one continuous variable (plus optional category)
dataset Try it with NBA Shot LocationsChartsRelationships & correlation 16

3D scatter plot
A rotatable cube in which every row is ONE point placed by three continuous measures on the x, y and z axes, with optional color by category and size by a fourth measure. The depth is real: the reader turns the cube by dragging it, and nearer points are drawn larger and more opaque so the third axis still reads in a still image
Works best with: Three continuous measures whose joint structure is the question, on a tile large enough to turn. To read exact values off three or more measures, Pair plot (scatter matrix) and Parallel coordinates are both more precise
dataset Try it with Real Estate Listings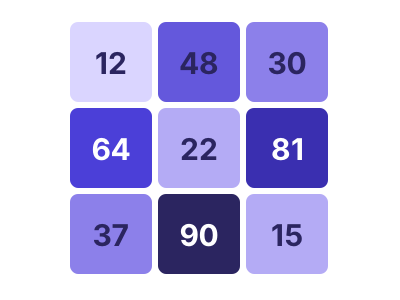
Annotated heatmap
Heatmap with annotations for each cell
Works best with: Requires two variables: categorical × categorical with values
dataset Try it with Airline Flight Delays
Binned bubble matrix
A grid of bubbles at the intersections of two BANDED axes — categorical/ordinal dimensions, or continuous variables binned into ordered ranges (e.g. income <30K / 30-50K / ...). Each cell holds ONE bubble whose size encodes an AGGREGATED measure (mean/sum/median) for the rows in that cell, and an optional independent color can encode a second measure; empty cells stay blank
Works best with: Two banded/categorical axes (or two continuous variables split into ranges) plus an aggregatable size measure per cell, with optional independent color. Choose this over a continuous Bubble chart when raw points would overplot into a blob, or when the axes are naturally grouped
dataset Try it with Household Expense Breakdown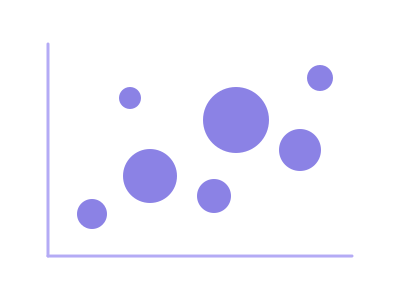
Bubble chart
A continuous bubble chart: each data row is ONE mark plotted at its raw (x, y) position on two CONTINUOUS numeric axes, with marker size encoding a third continuous measure (and optional color a fourth). The axes stay continuous — values are never grouped into bands
Works best with: Three continuous variables (x, y, size); one mark per row on continuous axes. If you want both axes grouped into bands with one aggregated bubble per cell, pick Binned bubble matrix instead
dataset Try it with Solar Panel Energy Output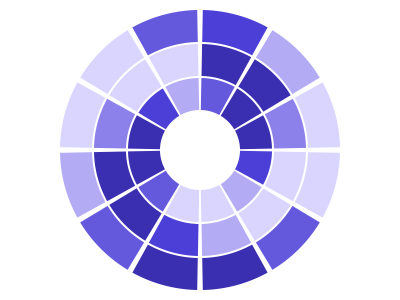
Circular heatmap
Circular heatmap to visualize values in radial layout
Works best with: Requires two dimensions - a cyclical one such as hour, weekday or month around the angle and a second category or date for the rings - and one measure for the color
dataset Try it with Product Release Timeline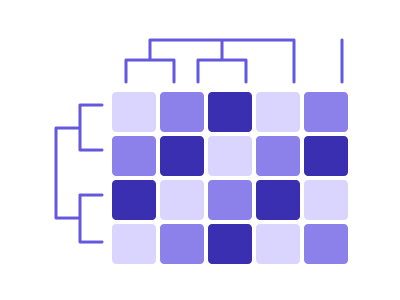
Clustered heatmap
Heatmap with clustering of rows and columns
Works best with: Requires two variables for matrix values
dataset Try it with Airline Flight DelaysNot in Excel: the add-in draws with D3, and this chart type has no D3 version.
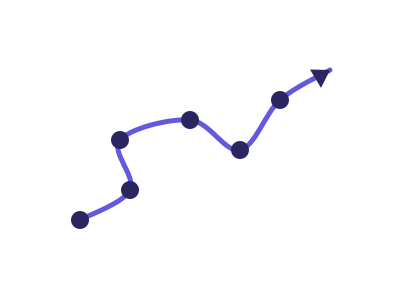
Connected scatterplot
A scatterplot of two measures whose points are connected in time order, tracing the path the relationship takes over time (with an arrowhead or start/end markers showing direction)
Works best with: Best for the joint trajectory of two related metrics over time (e.g. units vs revenue, unemployment vs inflation) where the path shape is the insight
dataset Try it with Fitness Tracker — Daily Steps, Sleep & Heart Rate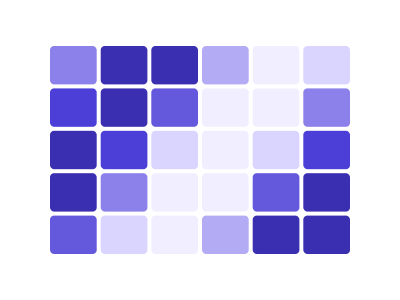
Heatmap
Heatmap showing one measure as color across a grid of two categorical or ordinal fields
Works best with: Requires two categorical or ordinal fields for the rows and columns, and one measure for the cell color
dataset Try it with Airline Flight Delays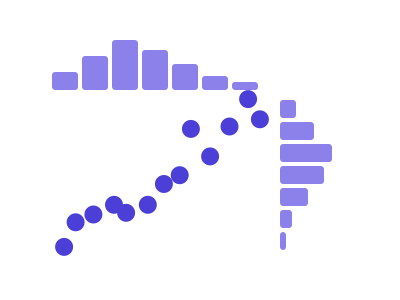
Joint plot
Joint plot for two variables combining scatter and distribution plots
Works best with: Requires two continuous variables
dataset Try it with Department Budget vs Actual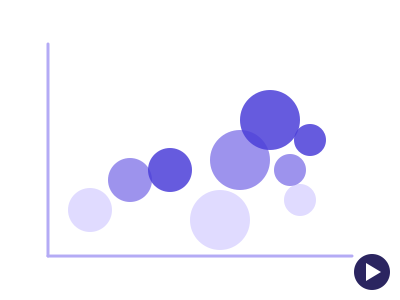
Motion bubble chart
A bubble chart played over time: each entity is ONE bubble that TRAVELS across two continuous axes period by period, sized by a third measure - the axes stay fixed, so a bubble moves only when its own values do
Works best with: Requires one categorical whose members are the bubbles, two measures for position and a time column with 3 or more ordered periods; best for watching entities travel - plans by subscribers and churn, countries by wealth and lifespan, teams by cost and output
dataset Try it with SaaS Subscription Metrics by Plan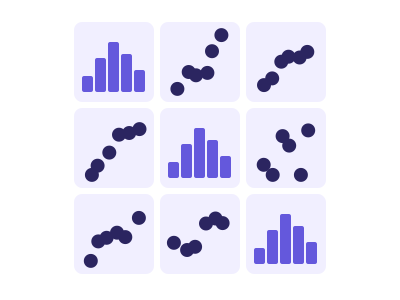
Pair plot (scatter matrix)
Pair plot for multiple continuous variables showing pairwise relationships
Works best with: Requires at least three continuous variables
dataset Try it with NBA Player Season Stats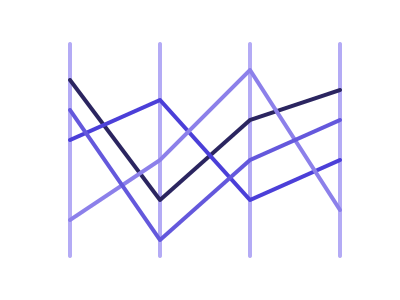
Parallel coordinates
Multivariate visualization with one parallel vertical axis per dimension; each row is rendered as a polyline connecting its value on every axis
Works best with: Best for 4-8 numeric dimensions and up to ~1000 rows (heavier overlap with more)
dataset Try it with Wine Chemistry & Ratings
Polar plot
Polar plot for circular data with continuous variables
Works best with: Requires angle and radius (two continuous variables)
dataset Try it with Fitness Tracker — Daily Steps, Sleep & Heart Rate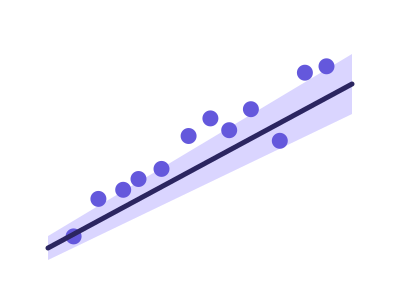
Regression plot (line with CI)
Regression line plot with confidence intervals
Works best with: Requires two continuous variables - a predictor and a response
dataset Try it with NBA Player Season Stats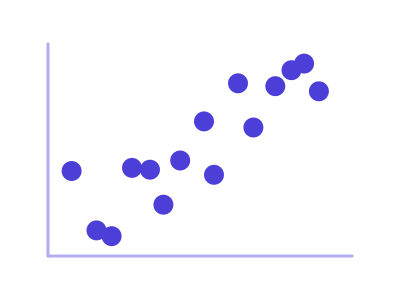
Scatter plot
Scatter plot of two continuous variables
Works best with: Requires two continuous variables
dataset Try it with Team Quota Attainment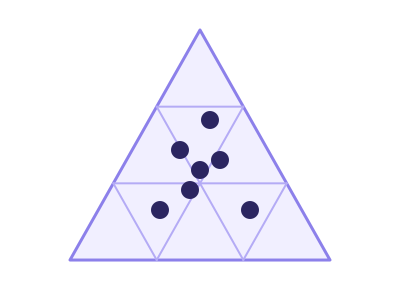
Ternary plot
A triangle whose three corners are three measures sharing a total, with every row placed inside it by how it splits between them - so clusters in the mix are visible at a glance instead of row by row
Works best with: Three measures that add up to the same total on every row - product mix, budget allocation, vote share, channel split
dataset Try it with Revenue Mix by AccountChartsPart-to-whole & hierarchy 13

Animated treemap
Treemap whose cell areas animate across an ordered time dimension, showing how a hierarchy's composition shifts period by period
Works best with: Requires a 2-level categorical hierarchy plus an additive measure observed at 3 or more ordered time points
dataset Try it with Consulting Engagement BillingsIn Power BI it needs a tile at least 560 px tall.
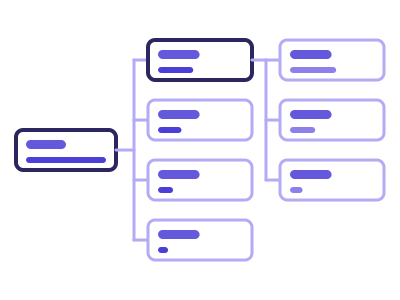
Decomposition cards
Decomposition cards: one total split into columns of cards, one category field per column, opened a card at a time
Works best with: One measure that adds up and two or more category fields; a second measure shows each card's change
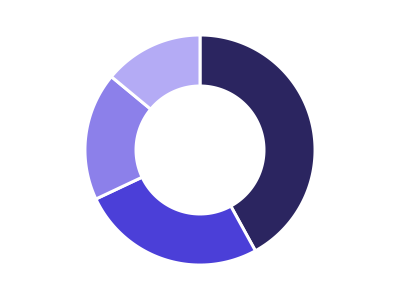
Donut chart
Donut chart showing category proportions
Works best with: Requires one categorical variable with proportions
dataset Try it with Support Cost by Team, Year over Year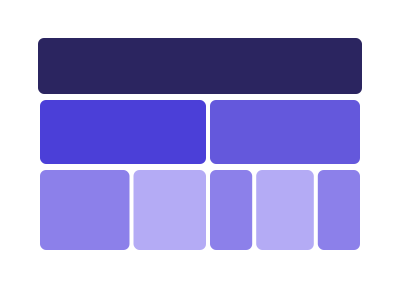
Icicle plot
Rectangular flat sibling of the sunburst; nested categorical hierarchy rendered as stacked rows or columns of proportionally-sized rectangles
Works best with: Best for 2-4 levels of hierarchy with ≤ ~50 leaves; an alternative to a sunburst when horizontal/vertical scanning is preferred
dataset Try it with Company Org Chart with Headcount
Marimekko / Mosaic plot
Two-dimensional proportional area chart: column widths encode one categorical total and within-column segment heights encode a second categorical's share
Works best with: Best for 3-10 outer × 3-10 inner categories with a positive measure
dataset Try it with Company Org Chart with Headcount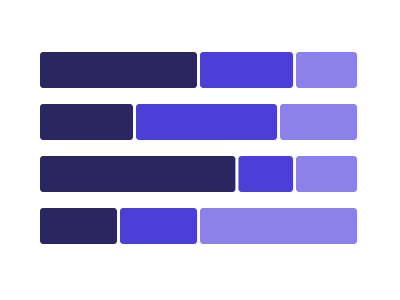
Normalized stacked bar chart
A horizontal stacked bar where every bar is scaled to the same full width, so the MIX is comparable across categories of very different size
Works best with: Best with two categoricals and one additive measure when the question is what the composition is rather than how big the total is
dataset Try it with Company Org Chart with Headcount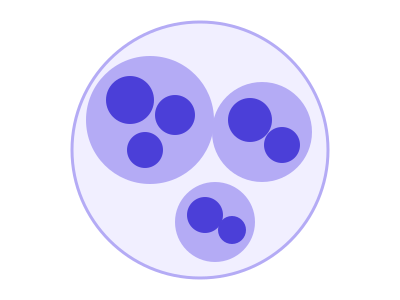
Packed circles
Hierarchical bubble layout where every node is a circle, packed without overlap inside its parent circle; sized by a numeric measure
Works best with: Best with one numeric measure plus 1-2 categorical groupings producing 20-150 leaves
dataset Try it with Company Org Chart with Headcount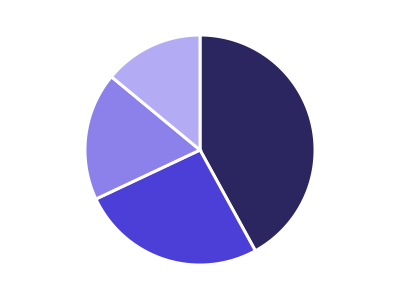
Pie chart
Pie chart showing proportion of categories
Works best with: Requires one categorical variable with proportions
dataset Try it with Support Cost by Team, Year over Year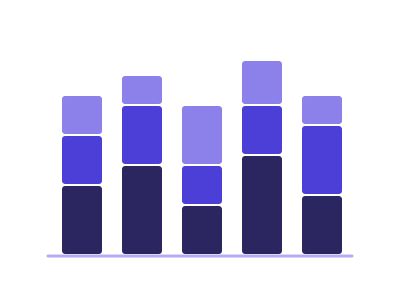
Stacked bar chart
Stacked bars for cumulative category comparisons
Works best with: Requires one categorical, one subcategory, and one numeric variable
dataset Try it with Product Release Timeline
Sunburst chart
Sunburst chart for hierarchical categorical data
Works best with: Requires hierarchical categorical data
dataset Try it with Company Org Chart with Headcount
Treemap
Treemap for hierarchical categorical data visualization
Works best with: Requires hierarchical categorical data with values
dataset Try it with Company Org Chart with Headcount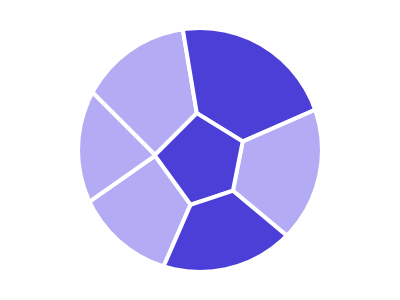
Voronoi treemap
Treemap variant using Voronoi cells (organic polygons) instead of axis-aligned rectangles, sized to encode a numeric measure
Works best with: Best for 5-30 categories with one non-negative measure; an alternative to a plain treemap when the organic look is desired
dataset Try it with Company Org Chart with Headcount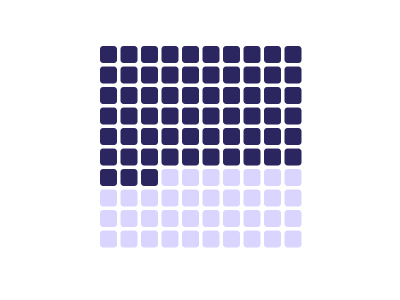
Waffle chart
Grid of squares showing proportions as colored cells within a fixed grid (typically 10x10 for percentages)
Works best with: Best for showing part-to-whole relationships with small number of categories; more accurate than pie charts
dataset Try it with Support Cost by Team, Year over YearChartsFlows & networks 8

Arc diagram
Nodes arranged along a single straight axis; edges drawn as semi-circular arcs above/below the axis to show pairwise relationships
Works best with: Best for 5-50 nodes and a sparse-to-medium-density set of pairwise relationships
dataset Try it with Order Fulfilment Process Flow
Basic Sankey
Visualizes flows from one categorical group (sources) to another categorical group (targets)
Works best with: Requires two categorical (nodes) and a continuous variable
dataset Try it with Order Fulfilment Process Flow
Chord diagram
Circular visualization showing flows or relationships between entities arranged around a ring, connected by curved arcs
Works best with: Requires matrix data showing bidirectional flows between entities; best for migration, trade, or relationship intensity data
dataset Try it with Order Fulfilment Process Flow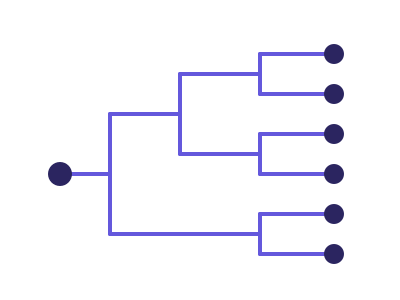
Dendrogram (tree diagram)
Hierarchical tree layout: each node is a categorical entity; edges connect parents to children at orthogonal angles
Works best with: Best for 2-4 hierarchy levels with ≤ ~80 leaves
dataset Try it with Company Org Chart with Headcount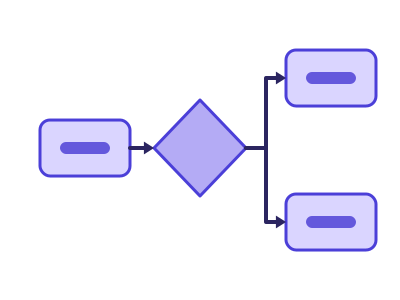
Mermaid diagram
Mermaid diagram: boxes, arrows and labels laid out automatically by Mermaid - a flowchart or process map from source-target rows (with swimlanes from a grouping column), an org tree or mind map from nested categories, or a timeline from dated events
Works best with: A source and a target column (a process, a hand-off chain, a dependency list), two to four nested categories (an org or product hierarchy), or a date beside an event name (milestones, releases, history) - up to a few dozen boxes
dataset Try it with Fitness Tracker — Daily Steps, Sleep & Heart Rate
Multi-level Sankey
Visualizes flows across more than two categorical stages, showing how quantities split and rejoin as they move through a sequence of categories or processes
Works best with: Requires three (or more) categorical and one continuous variable
dataset Try it with Order Fulfilment Process Flow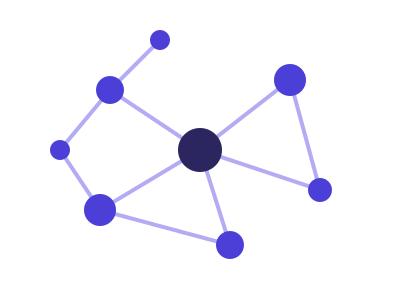
Network diagram
Force-directed graph visualization showing nodes and edges representing relationships or connections
Works best with: Requires node and edge data (source-target pairs); best for relationship, dependency, or social network visualization
dataset Try it with Order Fulfilment Process Flow
Sankey alluvial flow
Show how quantities move or transition between categories across multiple stages, with link widths emphasizing the relative size of each flow
Works best with: Requires at least two categorical variables
dataset Try it with Order Fulfilment Process FlowTry any of them on your own data
RegiaBI Apps, Maps and Charts is free to try in Power BI Desktop, and a 21-day trial key unlocks everything.