
Origin-Destination Flow Map
Each route drawn as a great-circle arc from its origin to its destination on a world basemap, with arc width encoding the size of the flow and a light-to-dark gradient showing which way it runs.
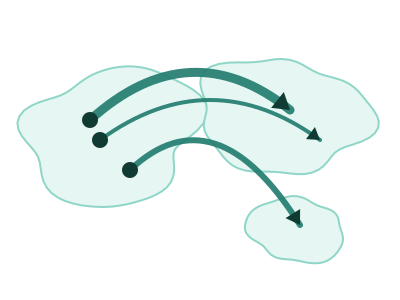
An illustration of the type, not a chart made from data.
When it fits
Use it when each row is a movement from one place to another with an amount: flights, shipping lanes, trade, migration or transfers between sites. Every route is drawn as an arc from its origin to its destination. The arc's width shows how much moved and its light-to-dark gradient shows which way, so the heavy lanes and their direction read at once.
When it doesn't
Arcs cross, and beyond a few dozen routes the map turns into a tangle; filter to the largest flows or to one origin first. If the geography doesn't matter and you only want who sends how much to whom, a Sankey chart shows the same amounts without the map. It needs both ends of every route.
The data it needs
Best for movement between places: flight routes, shipping and trade lanes, migration, commutes or transfers, where each row names where something started and where it ended plus a measure of how much moved.
Smallest size it draws at: 294 by 300 pixels.
How to ask for it
Pick Origin-Destination Flow Map from the list of what fits your data, or describe it in your own words:
- “Draw our shipping lanes from origin port to destination port, with width by tonnage”
- “Show passenger flows between cities as arcs on a world map”
Try it
Start with your own data in Power BI or Excel, or build it into your own app through the MCP server. Each one lists the types that fit your data before it builds anything.