Our Visuals

The engine underneath
A chart that fits your data, first try — no charting code to learn. That is RegiaBI, and it runs outside Power BI too.
What RegiaBI doesSelect a Product:

Number-line
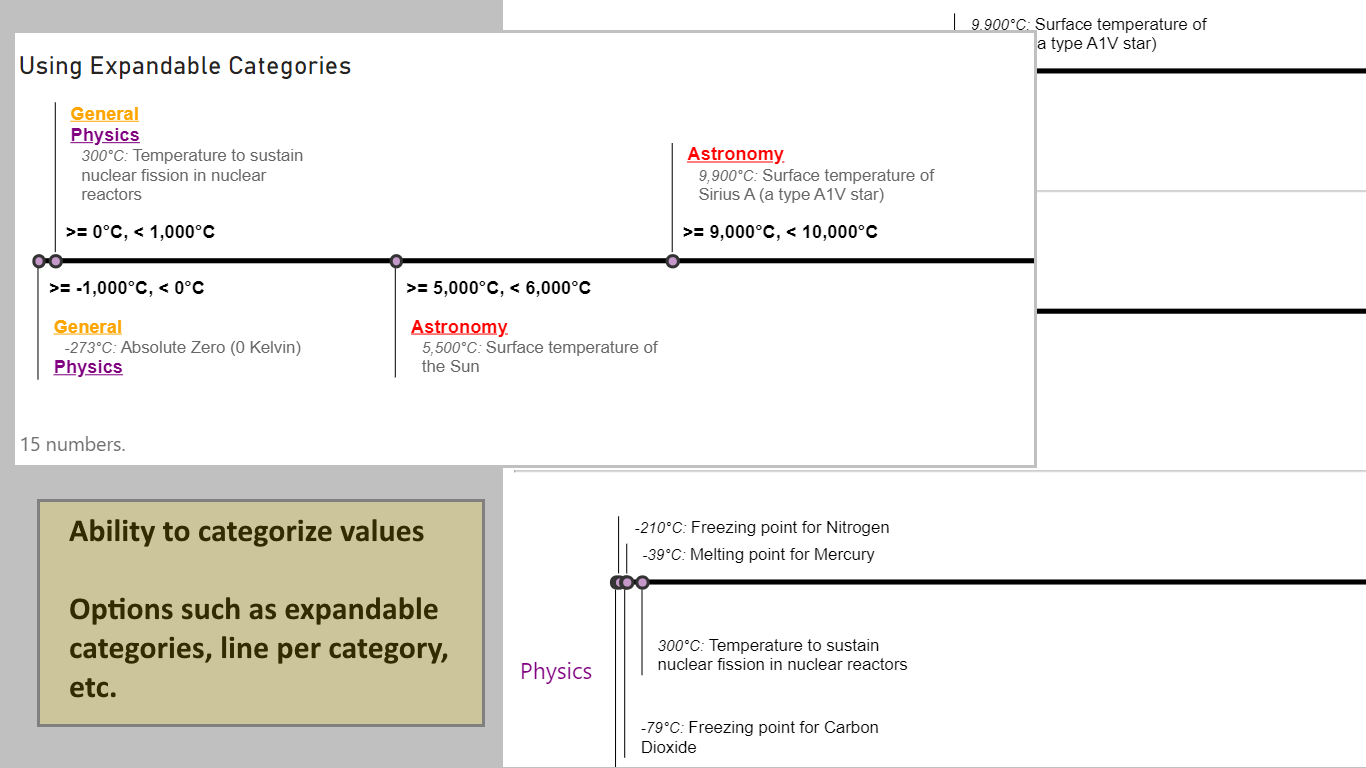
Take text narrative and place it on a number-line, based on values. Ability to group like-values and show ranges. Coloring, categories and embedded images are available features.
Highlights...
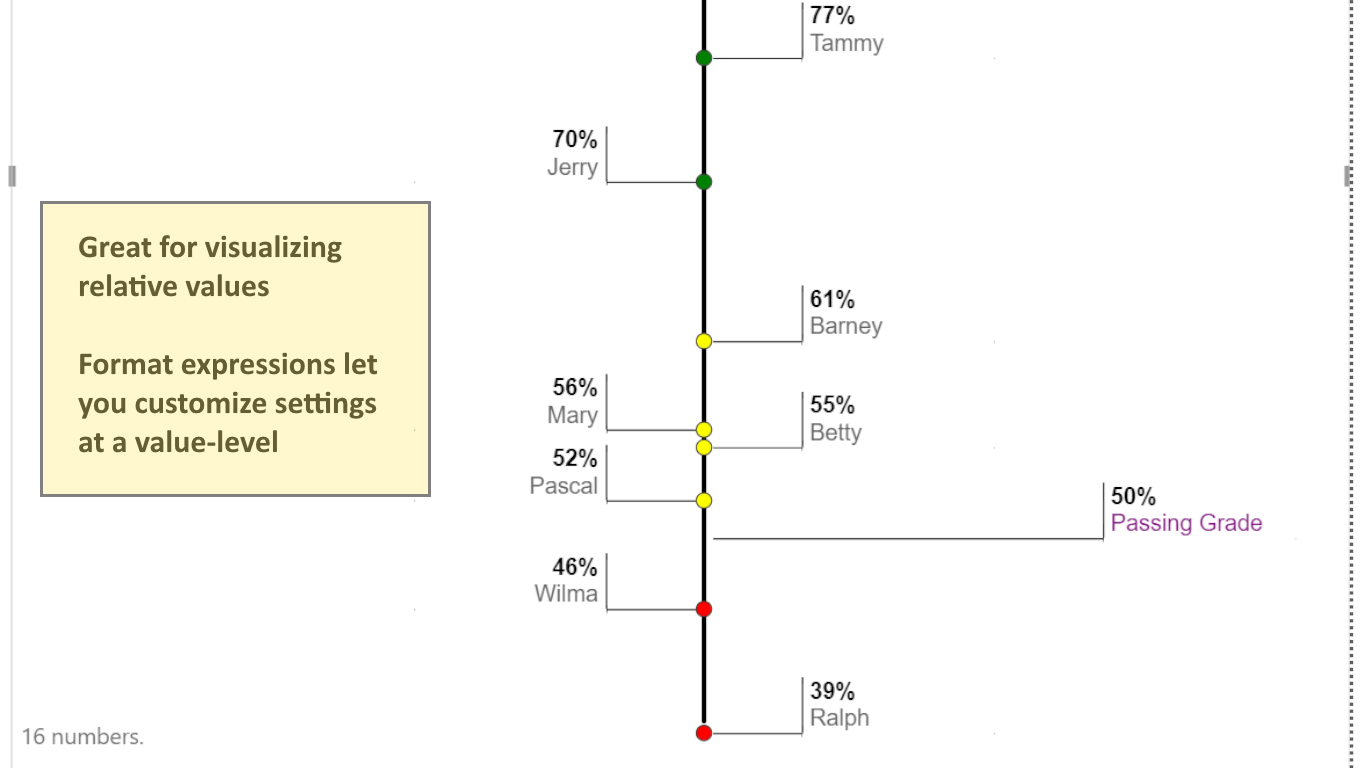
Use it for comparing results...
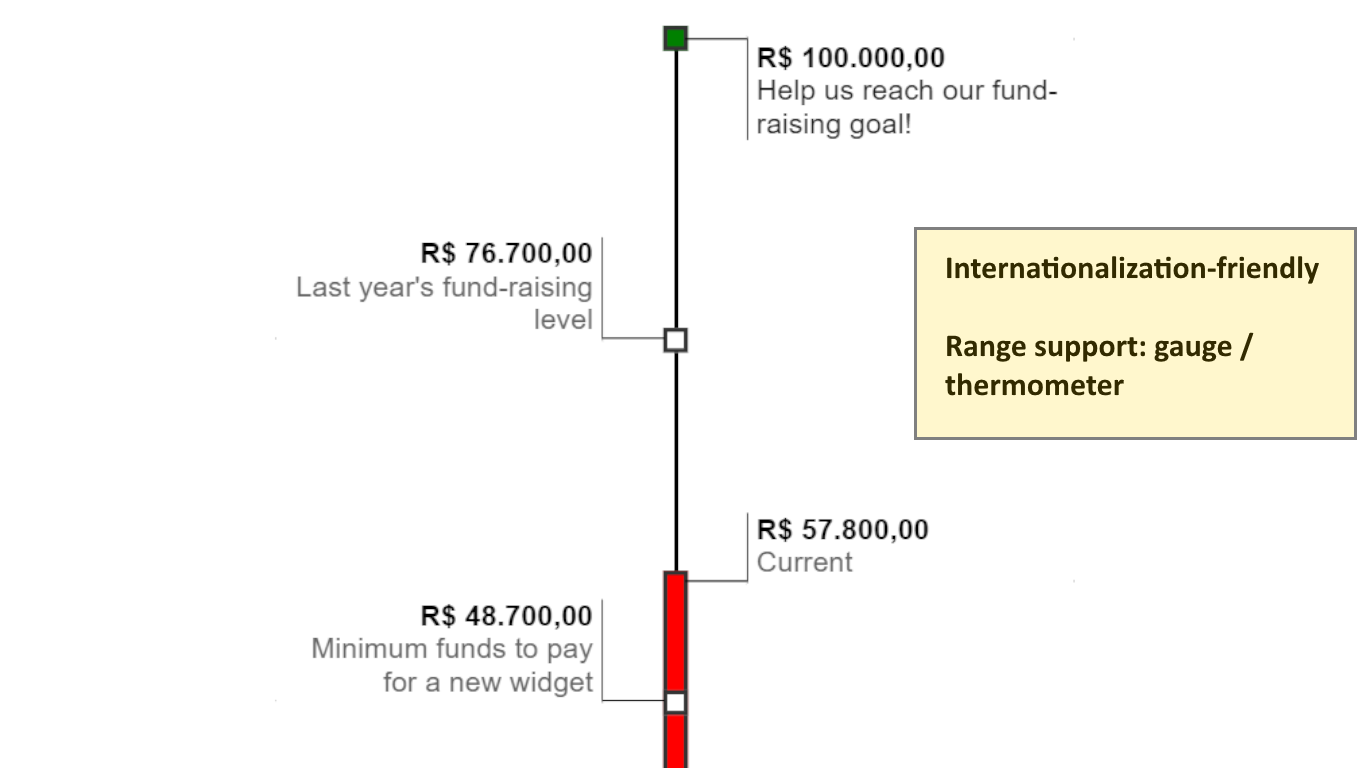
Can be used like a thermometer or a sophisticated gauge - with deep internationalization support
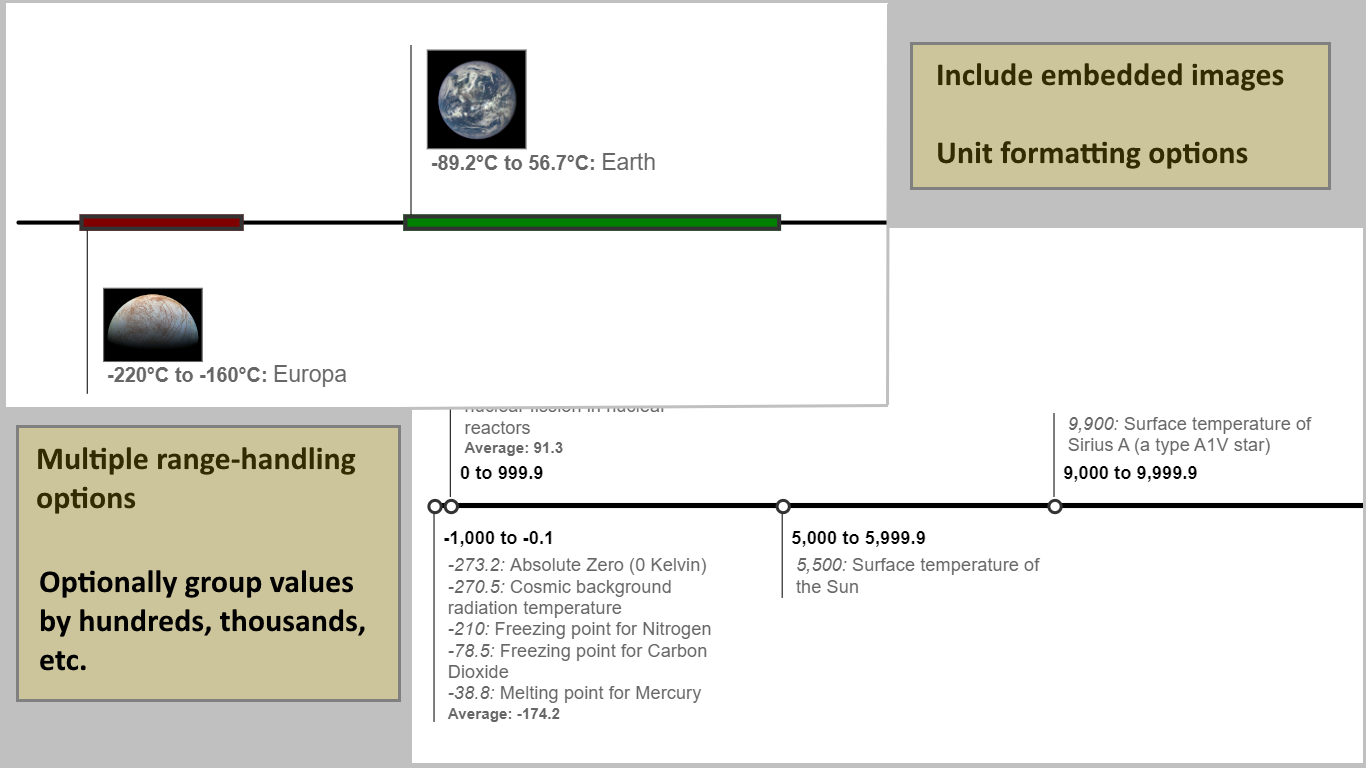
Ranges and grouping of values support
Expandable categories and line-per-category support