
Retention curves
How long customers stay, one step curve per group with a band for how sure it is, the median lifetime of each and plain words on which gaps are real.
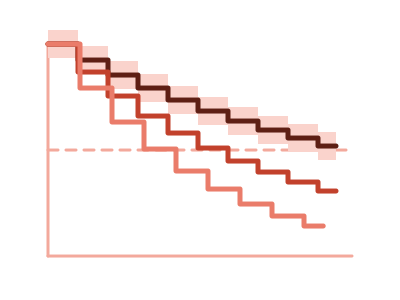
An illustration of the type, not a chart made from data.
What it does
Retention curves shows how long customers stay. It draws one step curve per group: the share of that group's customers still with you, month by month. Each curve has a band that shows how sure it is, and the chart gives each group's median lifetime.
Customers who haven't left are counted for as long as you've seen them, so a blank end date is expected, not a problem. Above the plot, plain words say which gaps between groups are real and which could be chance.
A Compare by switch changes which field splits the customers, such as channel or plan, and the curves are fitted again for that field. A group with fewer than 20 customers isn't drawn alone, and the caption says so. Clicking a curve or its legend entry cross-filters the page to that group's customers.
The chart describes the customers in your data. It doesn't say why a group leaves sooner, and it doesn't predict who will leave.
When it fits
Use it when you have one row per customer with when they started and when they left, blank while they're still a customer. Tenure and a column saying whether they left works too. Add a field to compare, such as channel or plan. It's offered from 30 customers, and asked for by name it's built from 10.
When it doesn't
It needs one row per customer, so a log of orders or events has to be summarized first. With very few customers it isn't built. To see retention by the period customers joined, use the Cohort retention triangle.
The data it needs
One row per customer with when they started and when they left (blank while still a customer), or their tenure and whether they left, plus a field to compare such as channel or plan - at least 30 customers.
Smallest size it draws at: 320 by 300 pixels.
How to ask for it
Pick Retention curves from the list of what fits your data, or describe it in your own words:
- “Draw retention curves showing how long customers stay, compared by acquisition channel”
- “Draw retention curves by plan with the median lifetime of each”
Where it runs
- Power BI
- Add the RegiaBI Apps, Maps and Charts visual from AppSource to your report, bind one row per customer with a start date and an end date, and a field to compare if you have one, and pick Retention curves from the list of what fits your data, or ask for it by name.
- Excel
- Get the RegiaBI Apps, Maps and Charts add-in from Home > Add-ins, select your table, and pick Retention curves from the list of what fits.
- AI agents
- Add the MCP server to your coding agent with npx -y @bicharts/chart-mcp. The agent asks which types fit your table, generates this one, and gets it as source code for your app.
Retention curves needs a license key, and a free 21-day trial gives you one that works. It isn't offered in free mode.
Try it
Start with your own data: the Power BI visual, the Excel add-in, the MCP server for AI agents. It lists the types that fit your data before it builds anything.
Questions people ask
What data does it need?
One row per customer with a start date and an end date that is blank while they're still a customer, or their tenure and whether they left. It's offered from 30 customers, and asked for by name it's built from 10.
How are customers who haven't left handled?
A blank end date means still a customer. Those customers count toward the curve for as long as you've seen them.
How do I know a gap between two groups is real?
The words above the plot say which gaps are real. Each curve's band shows how sure it is.
Do I need a license?
Yes. Retention curves needs a license key, and the key from the free trial works. It isn't offered in free mode.
Why does it say Preview?
It's available now and still being refined. A preview is built only when you pick it from the list or ask for it by name.