
USA Choropleth (by state)
US states shaded by a measure on a filled Albers-USA map, revealing state-level geographic patterns.
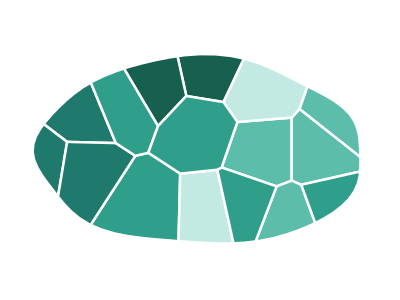
An illustration of the type, not a chart made from data.
When it fits
Use it for one measure per US state, keyed by state name or two-letter code: sales, users, or any rate that varies by state. It's the map most readers already know how to read, and it shows regional patterns, such as a measure that runs high across the Sun Belt, that a table hides.
When it doesn't
Large, thinly populated states take most of the ink and the small Northeastern states almost none, so raw totals mislead; use a rate, or switch to the US hex-tile cartogram, which gives every state the same space. For data finer than the state, the ZIP-3 map shows more.
The data it needs
Best for state-level US metrics: sales, users, or population by state, any measure that varies by US state (keyed to state names or USPS codes).
Smallest size it draws at: 294 by 300 pixels.
How to ask for it
Pick USA Choropleth (by state) from the list of what fits your data, or describe it in your own words:
- “Shade US states by sales per customer”
- “Show sign-up rate by state on a US map”
Try it
dataset Try it with U.S. Orders by ZIP CodeStart with your own data in Power BI or Excel, or build it into your own app through the MCP server. Each one lists the types that fit your data before it builds anything.