
Selection explainer
A scatter of two measures where you draw a lasso around a group of points and see which of your other fields set them apart from the rest - each with its share or median beside the rest's, tested against chance.
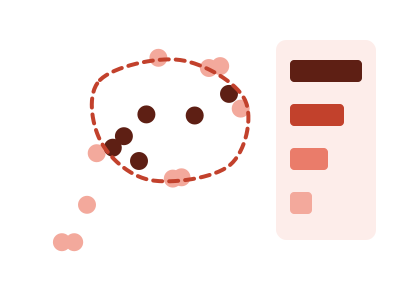
An illustration of the type, not a chart made from data.
What it does
Selection explainer draws a scatter of two measures, one dot per row, with a panel beside it or, on a narrow tile, under it. You draw around a group of dots with a lasso or a rectangle. The panel then ranks the other fields that differ between the dots you enclosed and the rest.
Each finding is a sentence with the group's share or median beside the rest's. Every difference is tested against chance, and the panel's footer prints how many comparisons were made and the correction applied. When one simple rule fits most of the selected dots and few of the others, the panel shows that rule first.
The panel says what differs and never why. When no field differs by more than chance, it says so, and that is an answer too. When the group is too small to test, it says how many dots are needed. Before you select anything, the panel lists the fields it will compare. Clicking a single dot cross-filters like any scatter.
When it fits
Use it when you can see a cluster or a set of outliers on a scatter and the question is "what do these points have in common?" It needs two measures over thirty or more rows that also carry other fields, such as region, plan, tenure or size.
When it doesn't
It compares only the fields you bound, so it can't find a cause that isn't in the table. It reports differences, not reasons. With only a few points selected, a difference can't be told from chance, and the panel says that instead of guessing.
The data it needs
Two measures over thirty or more rows that also carry other fields - region, plan, tenure, size - when the question is 'what do these points have in common?'.
Smallest size it draws at: 294 by 360 pixels.
How to ask for it
Pick Selection explainer from the list of what fits your data, or describe it in your own words:
- “Let me circle a group of customers on a scatter and tell me what sets them apart”
- “Build a selection explainer of spend against tickets and explain any group of points I select”
Where it runs
- Power BI
- Add the RegiaBI Apps, Maps and Charts visual from AppSource to your report and turn on Lasso Selection in the Format pane, under Interaction. Then bind two measures and your other fields, and pick Selection explainer from the list of what fits, or ask for it by name.
- Excel
- Get the RegiaBI Apps, Maps and Charts add-in from Home > Add-ins, select your table, and pick Selection explainer from the list of what fits.
- AI agents
- Add the MCP server to your coding agent with npx -y @bicharts/chart-mcp. The agent asks which types fit your table, generates this one, and gets it as source code for your app, where the host draws the lasso.
Try it
dataset Try it with Customer Spend and Support TicketsIn Power BI, turn on Lasso Selection first (Format pane, Interaction): you draw this chart's selection with a lasso.
Start with your own data: the Power BI visual, the Excel add-in, the MCP server for AI agents. It lists the types that fit your data before it builds anything.
Watch it built, step by step: What if AI built Excel apps and maps, not just charts?
Questions people ask
How does it decide a difference is real?
It tests each field's difference between the selected points and the rest against chance, and corrects for the number of fields compared. The footer of the panel prints the number of comparisons and the correction.
What happens when nothing stands out?
The panel says so, with the count, and shows the closest comparison muted and marked as possibly chance. A null result is drawn as an answer.
Why can't I draw a lasso in Power BI?
Lasso Selection is a setting of the visual and it starts off. Turn it on in the Format pane, under Interaction.
Why does it say Preview?
It's available now and still being refined. A preview is built only when you pick it from the list or ask for it by name.