
Budget allocator
A fitted diminishing-returns curve per channel, a total you set, and the split where each channel's next dollar earns the same, with the cost of any other split.
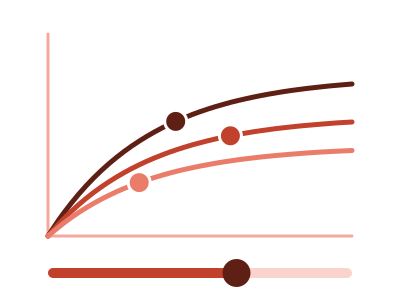
An illustration of the type, not a chart made from data.
What it does
Budget allocator reads a table of spend and outcome by channel and period. It fits one diminishing-returns curve per channel. You set the total with a slider or a typed box, and the chart shows the split where every channel's next dollar earns the same.
Three readouts compare the outcome at the current split, at the best split with its gain, and at your own split with its loss. Your own split starts when you drag a channel's dot along its curve. That channel is then held at the spend you chose, and the others re-solve around it. A reset returns the total to the current split's total and releases every channel you held.
The chart says "fitted" and "estimated". A channel whose data shows no diminishing returns is drawn straight and labeled, never bent. Every split stays inside the spend each channel has actually seen. Trend, seasonality and carry-over aren't modeled, and the caption says so. A curve describes past periods and doesn't promise a result.
When it fits
Use it when you have one spend measure and one outcome by channel and period, such as monthly spend and signups for five marketing channels, or budget and sales by region. It needs two to eight channels, and it's offered from eight periods per channel.
When it doesn't
It doesn't model trend, seasonality or carry-over between periods, so it isn't a full media mix model. It won't recommend spending beyond the range a channel has already seen. With fewer than eight periods for a channel it isn't offered, and under four it isn't built.
The data it needs
One spend measure and one outcome by channel and period - monthly spend and signups for five marketing channels, budget and sales by region - with at least eight periods per channel.
Smallest size it draws at: 440 by 380 pixels.
How to ask for it
Pick Budget allocator from the list of what fits your data, or describe it in your own words:
- “Build a budget allocator that splits my marketing budget across channels for a total I set”
- “Fit a response curve per channel and let me drag each channel's spend”
Where it runs
- Power BI
- Add the RegiaBI Apps, Maps and Charts visual from AppSource to your report, bind a spend, an outcome, a channel and a date, and pick Budget allocator from the list of what fits your data, or ask for it by name.
- Excel
- Get the RegiaBI Apps, Maps and Charts add-in from Home > Add-ins, select your table, and pick Budget allocator from the list of what fits.
- AI agents
- Add the MCP server to your coding agent with npx -y @bicharts/chart-mcp. The agent asks which types fit your table, generates this one, and gets it as source code for your app.
Try it
Start with your own data: the Power BI visual, the Excel add-in, the MCP server for AI agents. It lists the types that fit your data before it builds anything.
Questions people ask
What data does it need?
One spend measure and one outcome by channel and period, for two to eight channels, offered from eight periods per channel. Rows finer than one period of one channel are summed, and the caption says so.
What does "best split" mean here?
The split of the total where each channel's next dollar earns the same on its fitted curve. The readout beside it gives the estimated gain over the current split.
Can it tell me to spend more than I ever have on a channel?
No. Every split stays inside the spend each channel has actually seen in your data.
Why does it say Preview?
It's available now and still being refined. A preview is built only when you pick it from the list or ask for it by name.