
Oceania (Bubbles)
Each row plotted as a bubble on a map of Oceania - positioned by its latitude/longitude, or by its province, city or country when it has none - with bubble size encoding one measure and color a second measure or a category.
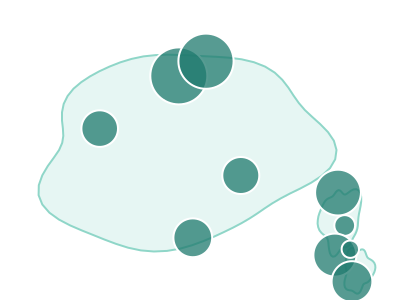
An illustration of the type, not a chart made from data.
When it fits
Use it when your rows are places in Oceania: branches in Sydney, Melbourne and Auckland, sites across the Pacific islands, or customers by city. Bubbles suit a region where the land is scattered and the places are far apart. Size carries one measure, color a second measure or a category, and a row is placed by its coordinates or, without them, by its city, province or country.
When it doesn't
Most of the region's people live in a few cities on Australia's east coast and in New Zealand, so those bubbles crowd while the rest of the map stays empty. For a rate compared across countries, use the Oceania Choropleth; for a short list of cities, a bar chart is more direct.
The data it needs
Best for point, city, province or country data within Oceania: stores, offices, customers or revenue by place, with a measure for bubble size and optionally a second measure or category for color.
Smallest size it draws at: 294 by 300 pixels.
How to ask for it
Pick Oceania (Bubbles) from the list of what fits your data, or describe it in your own words:
- “Map our locations in Oceania as bubbles sized by revenue”
- “Show customers by city across Australia and New Zealand, colored by plan”
Try it
Start with your own data in Power BI or Excel, or build it into your own app through the MCP server. Each one lists the types that fit your data before it builds anything.