
Cutoff tuner
Drag a cutoff along a score and see the right and wrong calls it makes against the real outcome - a live 2x2, the ROC or precision-recall curve, both score distributions, and the cheapest cutoff for the costs you type.
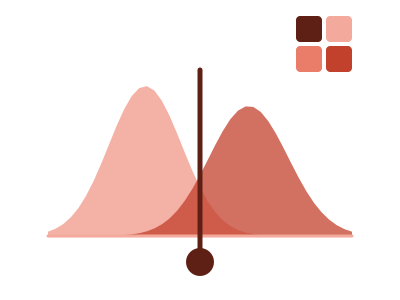
An illustration of the type, not a chart made from data.
What it does
Cutoff tuner takes one row per case, with a score and the actual yes or no outcome. You drag a cutoff along the score. A two-by-two table counts the right and wrong calls that cutoff makes, flagged or not flagged against actual yes and actual no, with its rates in plain words.
Beside the table are the ROC curve or the precision-recall curve, on a toggle, and both score distributions with the cutoff drawn through them. Type what a false alarm costs and what a miss costs, and the chart shows the cheapest cutoff for those costs.
The chart works out which outcome value it flags for and which way the score points, prints both in words, and lets you swap the flagged value. Accuracy is never the headline, because flagging nobody can look accurate when the outcome is rare. Clicking a cell of the table or a bar of a distribution cross-filters the page to those cases.
When it fits
Use it when you have a model score or a rating beside what really happened, such as churn, fraud, default or conversion, and the question is where to draw the line and what each choice costs.
When it doesn't
It needs a yes or no outcome and a numeric score beside it; without both it isn't built. With fewer than five cases of the rarer outcome it isn't built. It says how this score sorted these rows and nothing about future rows. With few cases of the rarer outcome, each step on the curve is one case, and the caption says so.
The data it needs
One row per case with a model score or rating and the actual yes/no outcome - churn, fraud, default, conversion - when the question is where to draw the line and what each choice costs.
Smallest size it draws at: 560 by 360 pixels.
How to ask for it
Pick Cutoff tuner from the list of what fits your data, or describe it in your own words:
- “Let me drag a cutoff on churn probability and see the false alarms and misses”
- “Tune the fraud score threshold and show the cheapest cutoff for the costs I type”
Where it runs
- Power BI
- Add the RegiaBI Apps, Maps and Charts visual from AppSource to your report, bind a score and a yes or no outcome with one row per case, and pick Cutoff tuner from the list of what fits your data, or ask for it by name.
- Excel
- Get the RegiaBI Apps, Maps and Charts add-in from Home > Add-ins, select your table, and pick Cutoff tuner from the list of what fits.
- AI agents
- Add the MCP server to your coding agent with npx -y @bicharts/chart-mcp. The agent asks which types fit your table, generates this one, and gets it as source code for your app.
Try it
dataset Try it with Loan Default PredictorsStart with your own data: the Power BI visual, the Excel add-in, the MCP server for AI agents. It lists the types that fit your data before it builds anything.
Questions people ask
What data does it need?
One row per case with a numeric score or rating and the actual yes or no outcome.
How does it pick the cheapest cutoff?
You type two costs, one for a false alarm and one for a miss. With both typed, the chart marks the cutoff where the total cost over the rows in view is lowest.
Can a Power BI What-If parameter set the cutoff?
Yes. Bind the parameter's measure and it owns the cutoff. The chart then draws no cutoff slider and prints which column the cutoff comes from.
Why does it say Preview?
It's available now and still being refined. A preview is built only when you pick it from the list or ask for it by name.