
Cohort retention triangle
For the customers who joined in each period, the share still with us one, three, six and more months later, with the months nobody could have seen yet shown as not seen.
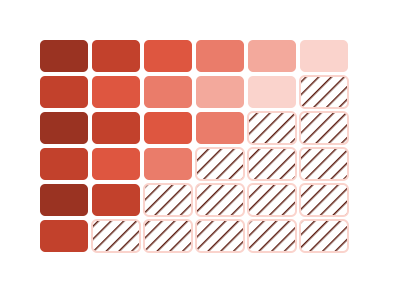
An illustration of the type, not a chart made from data.
What it does
Cohort retention triangle draws a grid. Each row is the group of customers who joined in one period, called a cohort. Each column is a number of months since joining. Each cell is the share of that cohort still with you that many months later, and a footer row gives the share over every cohort.
Recent cohorts haven't been around long enough to fill their later months. Those cells are hatched and labeled as not seen yet. They're never shown as zero, because nobody could have been watched that long.
A cohort with fewer than ten customers is shown in gray with its size and no percentages, since a share of so few would mislead. On a narrow tile the grid shows landmark months, such as 1, 3, 6 and 12, and says so under the grid. Clicking a cohort's label or one of its cells cross-filters the page to that cohort's customers.
When it fits
Use it when you have one row per customer with a start date and an end date that is blank while they're still a customer. It needs a year or more of starts to have several cohorts to compare. It answers whether customers who joined lately stay as well as those who joined earlier.
When it doesn't
It needs a real start date for each customer; tenure alone can't place a customer in a cohort. With less than a year of starts there are few cohorts to compare. To compare groups such as channel or plan, use Retention curves.
The data it needs
One row per customer with a start date and an end date that is blank while still a customer, over at least a year of starts.
Smallest size it draws at: 340 by 280 pixels.
How to ask for it
Pick Cohort retention triangle from the list of what fits your data, or describe it in your own words:
- “Show a cohort retention table by the month customers joined”
- “Build a cohort retention triangle by the quarter customers joined”
Where it runs
- Power BI
- Add the RegiaBI Apps, Maps and Charts visual from AppSource to your report, bind one row per customer with a start date and an end date, and pick Cohort retention triangle from the list of what fits your data, or ask for it by name.
- Excel
- Get the RegiaBI Apps, Maps and Charts add-in from Home > Add-ins, select your table, and pick Cohort retention triangle from the list of what fits.
- AI agents
- Add the MCP server to your coding agent with npx -y @bicharts/chart-mcp. The agent asks which types fit your table, generates this one, and gets it as source code for your app.
Cohort retention triangle needs a license key, and a free 21-day trial gives you one that works. It isn't offered in free mode.
Try it
Start with your own data: the Power BI visual, the Excel add-in, the MCP server for AI agents. It lists the types that fit your data before it builds anything.
Questions people ask
What data does it need?
One row per customer with a start date and an end date that is blank while they're still a customer. It needs a year or more of starts to have several cohorts to compare.
Why are some cells hatched?
Those are months nobody in that cohort could have reached yet. They're marked as not seen yet and never shown as zero.
Do I need a license?
Yes. Cohort retention triangle needs a license key, and the key from the free trial works. It isn't offered in free mode.
Why does it say Preview?
It's available now and still being refined. A preview is built only when you pick it from the list or ask for it by name.