
What-if projection
One measure over time, then a projected continuation the reader steers with an on-chart growth-rate slider and a horizon slider - the end value and the period a target is reached print beside the assumption, and a bound What-If parameter can own the rate instead.
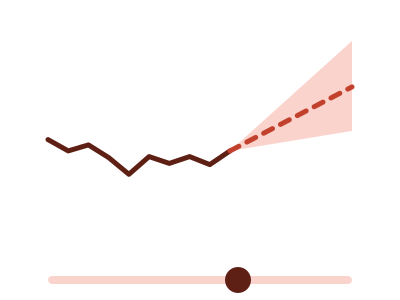
An illustration of the type, not a chart made from data.
What it does
What-if projection draws one measure over time and then continues it past the last actual value. The continuation is compound growth at a rate you set, over a horizon you set, with two sliders inside the chart. The rate slider starts at the rate your history shows, and the caption says how that rate was worked out.
Three readouts sit above the plot and change as you drag. The first is the end value at the horizon. The second is the gap against a flat continuation, which holds your history at its latest level with no growth. The third says when a target is reached, when your data carries a target.
The projection is an assumption you state, not an estimate. The chart fits no model and draws no confidence band, and the dashed line's label names the rate and who set it. When you filter the report, the projection starts again from the filtered actuals. In Power BI, a What-If parameter you already have can set the rate in place of the slider.
When it fits
Use it when the question is what happens next under an assumption you choose: revenue against a target, headcount, subscribers. It needs one measure over dates with at least six periods. With a category of up to four values bound, each value gets its own line, and the readouts use the per-period total, or an average for a rate.
When it doesn't
It isn't a forecast. It fits no model to your history, so it can't tell you what is likely, only what a rate you chose leads to. With fewer than six periods it isn't offered. To see several rates side by side, use What-if scenarios.
The data it needs
A dated measure with at least six periods when the question is what happens next under an assumption the reader chooses - revenue against a target, headcount, subscribers; bind a What-If parameter measure to drive the rate from a slicer.
Smallest size it draws at: 294 by 280 pixels.
How to ask for it
Pick What-if projection from the list of what fits your data, or describe it in your own words:
- “Show a what-if projection of revenue with a growth rate I can change”
- “Build a what-if projection of subscribers against the target with a growth rate I can change”
Where it runs
- Power BI
- Add the RegiaBI Apps, Maps and Charts visual from AppSource to your report, bind a date and a measure, and pick What-if projection from the list of what fits your data, or ask for it by name.
- AI agents
- Add the MCP server to your coding agent with npx -y @bicharts/chart-mcp. The agent asks which types fit your table, generates this one, and gets it as source code for your app.
Try it
dataset Try it with Divisional Revenue by YearStart with your own data: the Power BI visual, the MCP server for AI agents. It lists the types that fit your data before it builds anything.
Questions people ask
Is this a forecast?
No. The projection compounds the rate you set, from your last actual value or, with two or more years of history, from the same period a year earlier. Nothing is fitted to the history, and the chart says "projected" and "assumes", never "forecast".
Can a Power BI What-If parameter drive the rate?
Yes. Bind the parameter's measure and it sets the rate. The chart then draws no rate slider and prints which column the rate comes from.
How much history does it need?
A dated measure with at least six periods. Past about 200 points the chart groups the dates to a coarser grain and says so in its caption.
Why does it say Preview?
It's available now and still being refined. A preview is built only when you pick it from the list or ask for it by name.