
Our Visuals

The engine underneath
An app, map or chart that fits your data, first try — no charting code to learn. That is RegiaBI, and it runs outside Power BI too.
What RegiaBI doesSelect a Product:

RegiaBI Apps, Maps and Charts for Google Sheets
See it work before you sign in
See sample charts draws finished charts over our own sample table, one after another. No account, no sign-in, and nothing of yours is measured or sent — it's the product doing the thing, on data we supply.
The list of what fits reads the columns in your range and ranks the chart types that suit them. It reaches no AI and costs nothing, so you can see what your own data could become before you decide anything.
A chart you've made redraws for free. It's kept in the spreadsheet, so opening the add-on again draws it from there with no sign-in and no call for a new one. Generating a chart is what needs a licensed account.
How it works, in three steps
- Open it from Extensions. Select a range whose first row is the column headers, then Menu > Use selection. The range summary tells you what it read.
- Highlight a chart type from the list, or leave it to choose. Add a sentence about what you want, or leave the box empty.
- Click Generate. The chart is drawn in the window, and after that it redraws from the code kept in your spreadsheet as your cells change, with no further call to us.
Not quite right? Adjust takes a sentence — “make the bars horizontal”, “label the top five” — and keeps your chart while it applies the change.
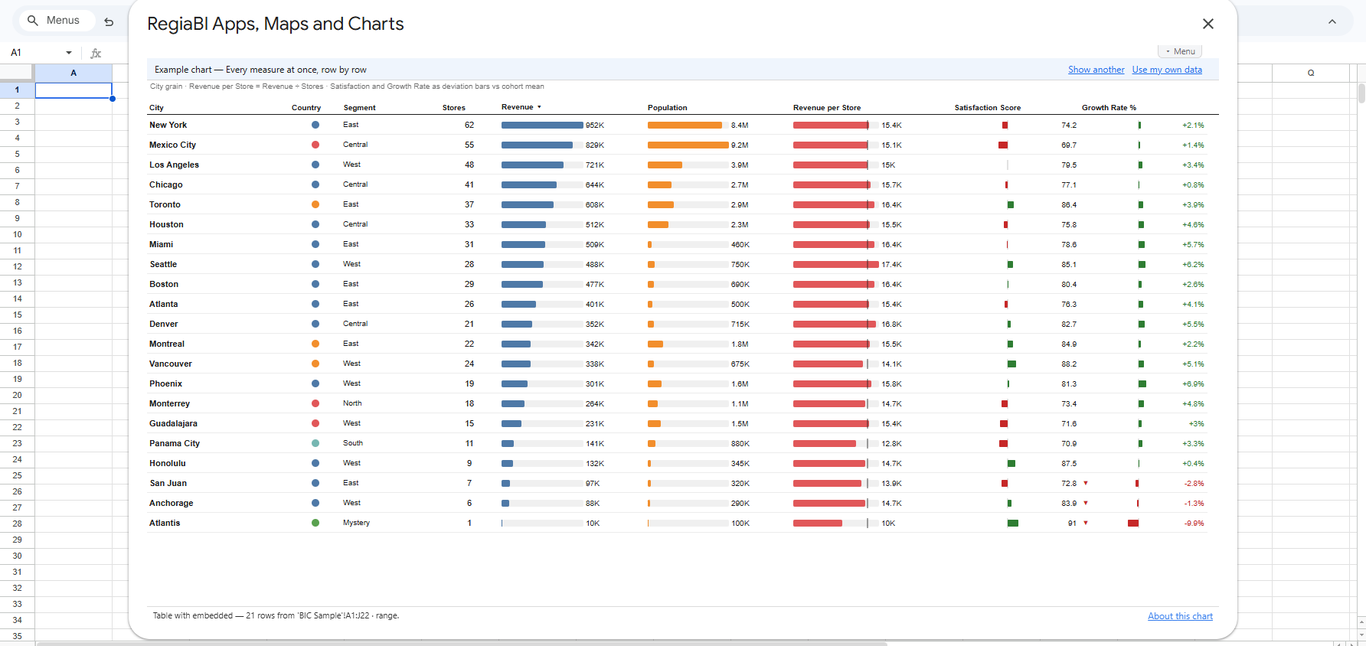
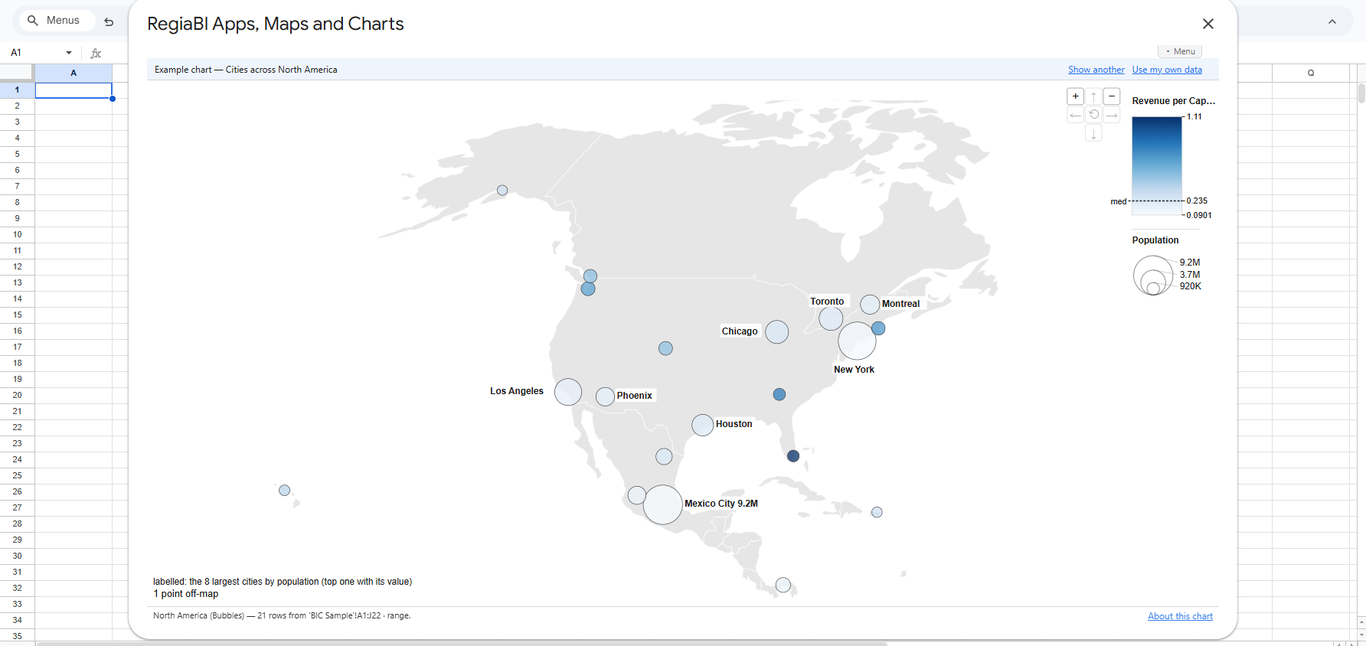
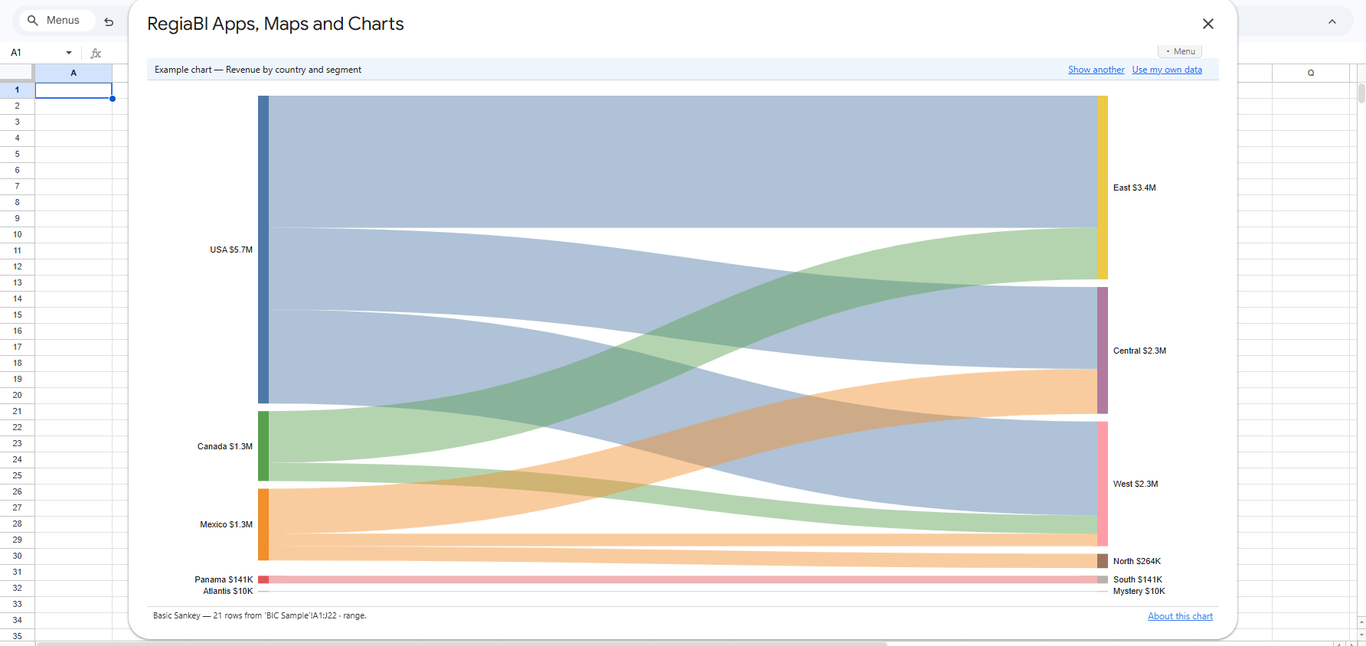
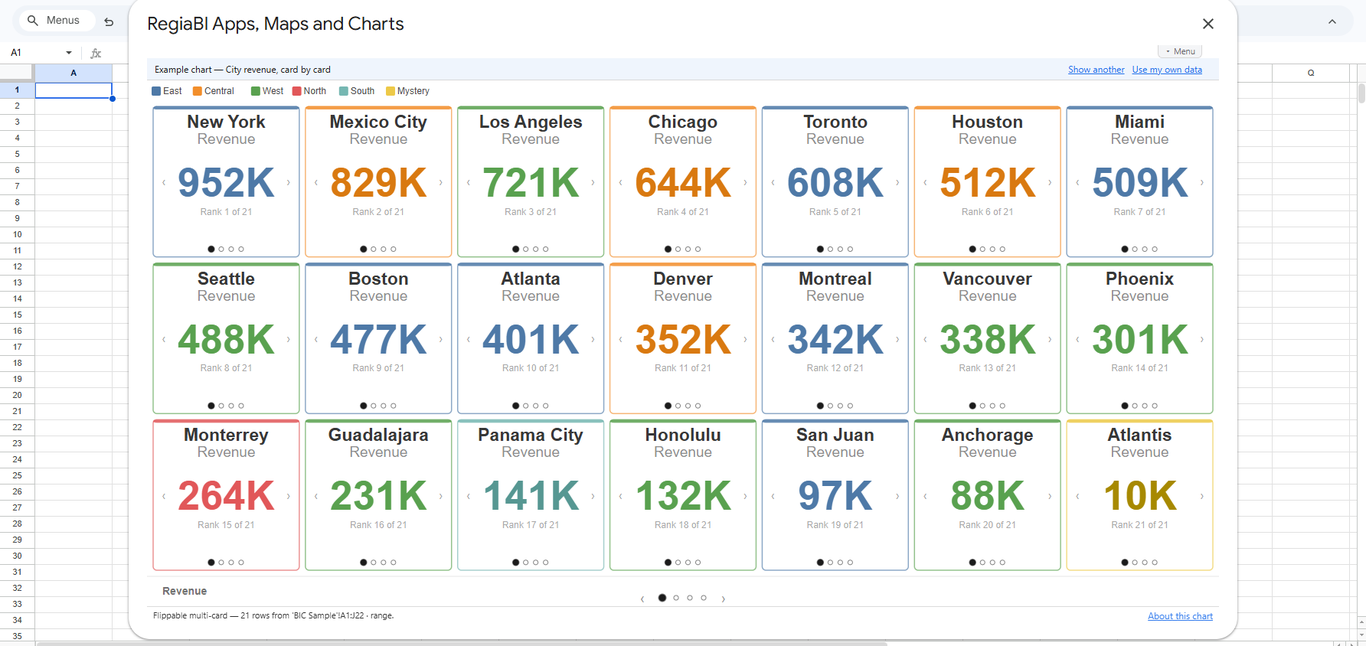
What's different in a spreadsheet from Google
- A window, not an object on the sheet. Google gives an add-on a window over the spreadsheet rather than a place in the grid. The live chart is there, opened from Extensions; Place in sheet puts a picture of it beside your data, and pressing it again replaces that picture.
- It follows your cells within a few seconds. An edit, a row typed underneath, or rows you hide or filter reach the chart shortly after, while the window is open.
- It binds a range. A range you select, or the data around the cell you're on.
- It asks for two permissions, both narrow: the spreadsheet you have open, and showing its window. It can't see your other spreadsheets or your Drive.
The same engine as the Power BI visual and the Excel add-in
This is RegiaBI Apps, Maps and Charts for Power BI and for Excel in a third host: the same gallery, the same picker, the same plain-English refinement, the same account and the same credits. What changes is where the data comes from — a range in your spreadsheet — and where the chart lives.
Google Sheets™ is a trademark of Google LLC.