
Our Visuals

The engine underneath
A chart that fits your data, first try — no charting code to learn. That is RegiaBI, and it runs outside Power BI too.
What RegiaBI doesSelect a Product:

Multi-Format / Animation / Export / Text from Values Card
Generate text output from source data in a range of formats - or roll your own using templates. Optionally render your output using animations like "flip" and "fade".
Highlights...
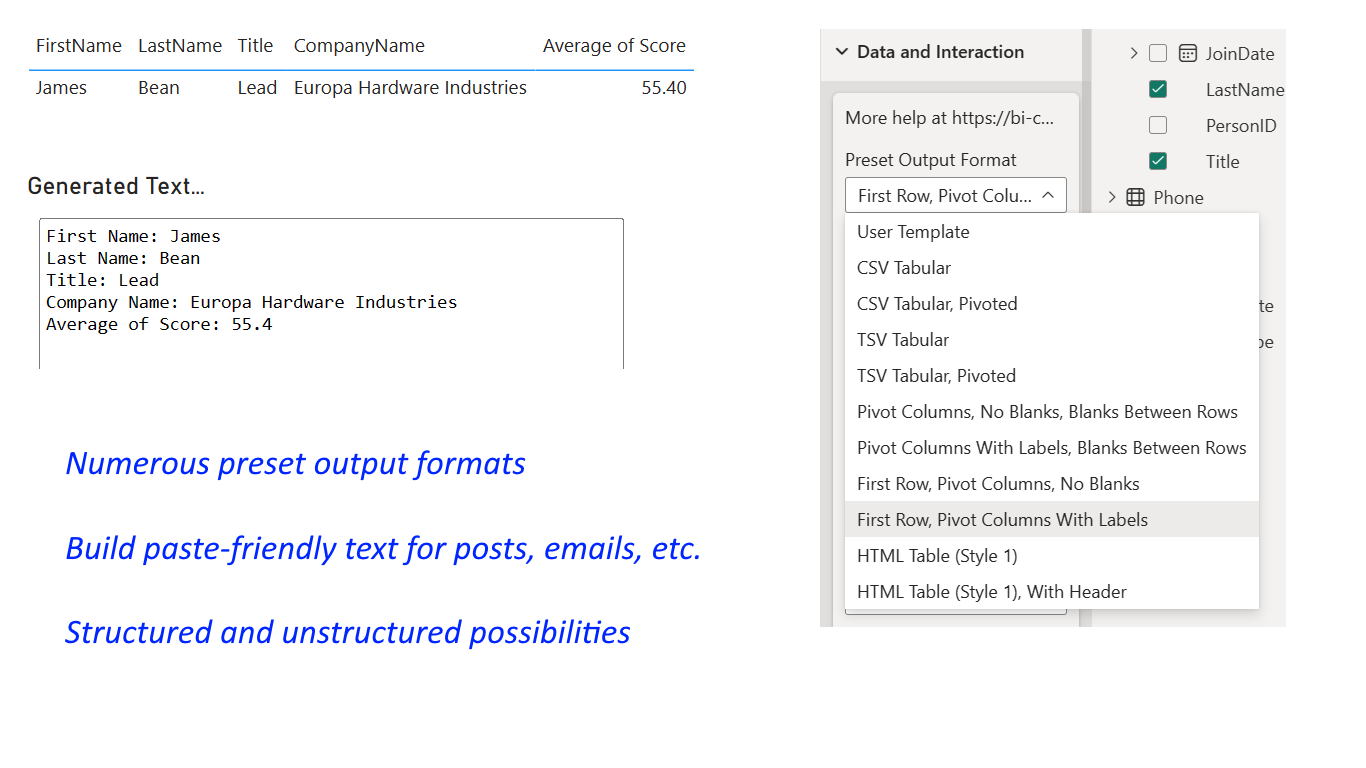
You can choose from a range of preset formats, or use a user defined template...
Apply transitions between card values that can change, per source row...
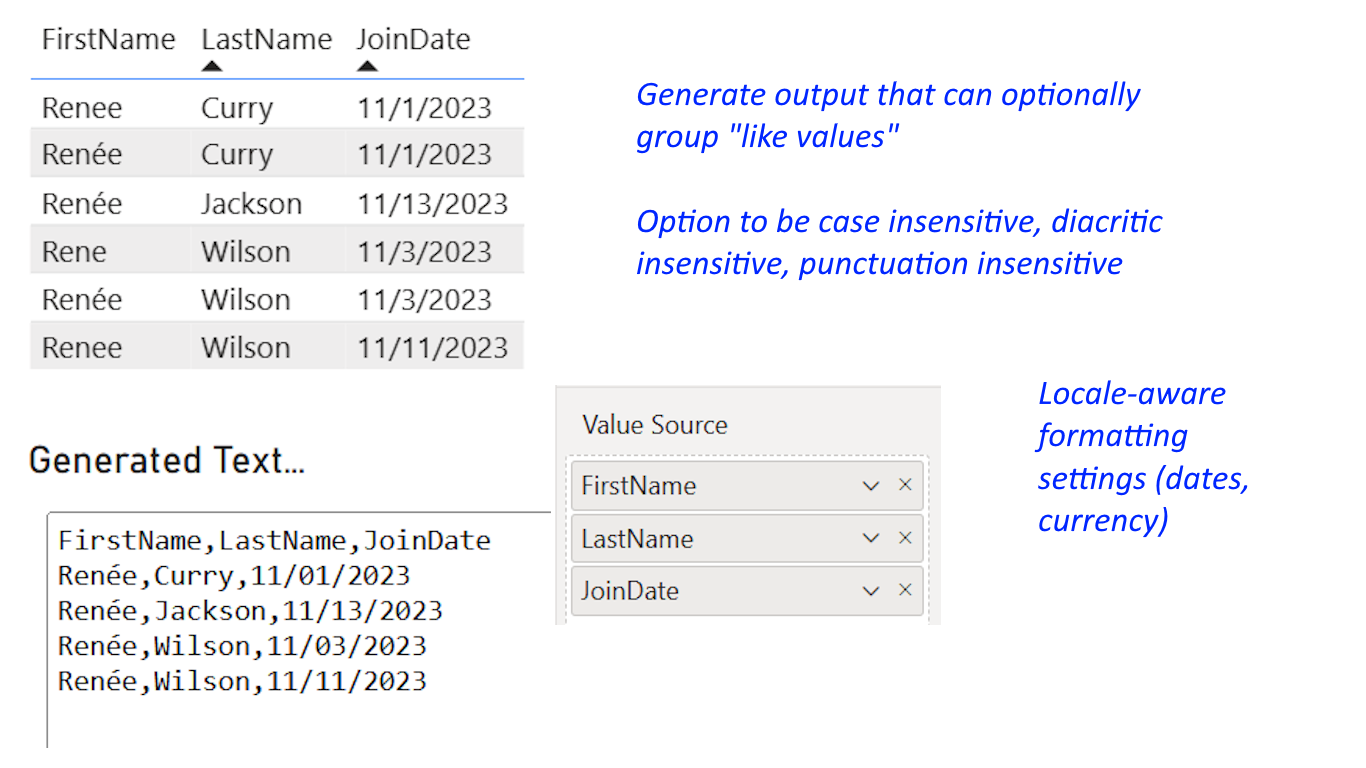
Merging algorithms are available to consolidate "like values" in your data...
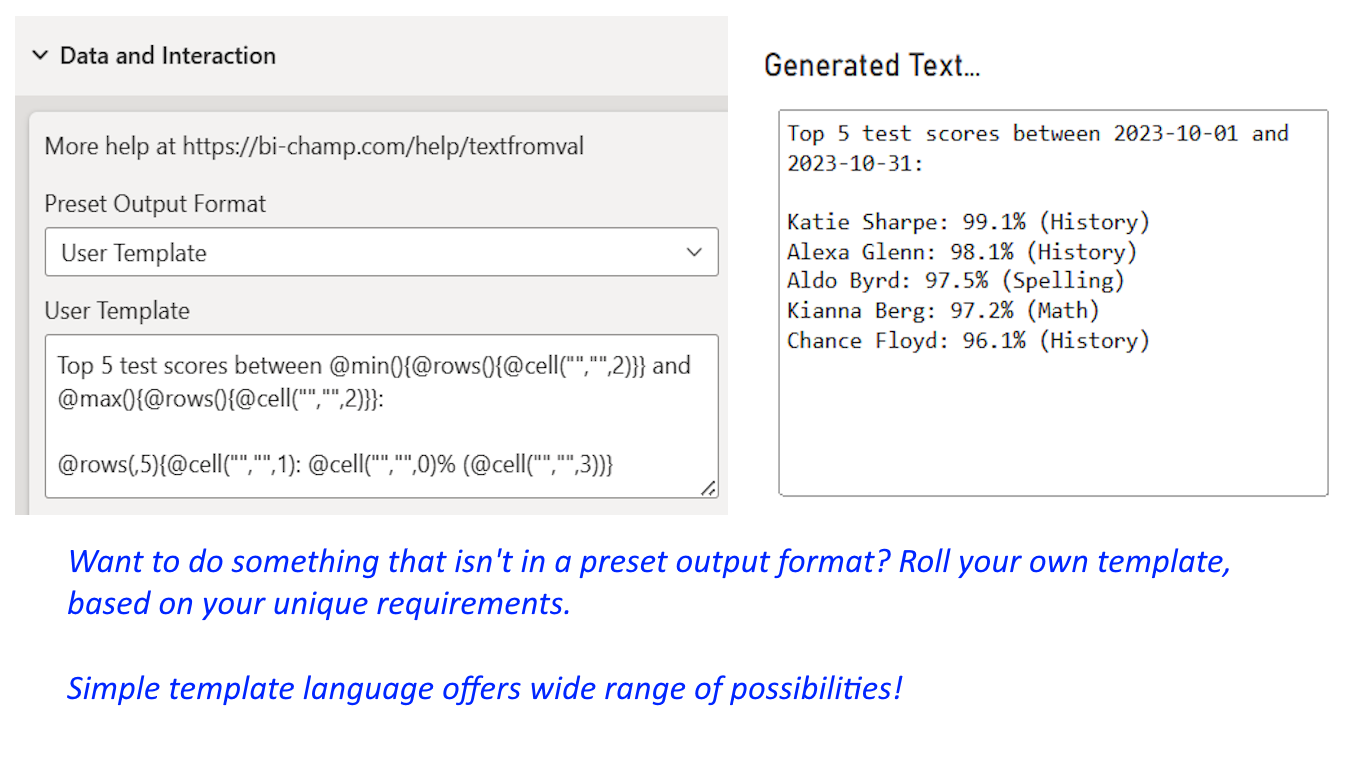
A simple yet powerful template language can be used to build output exactly like you want it...
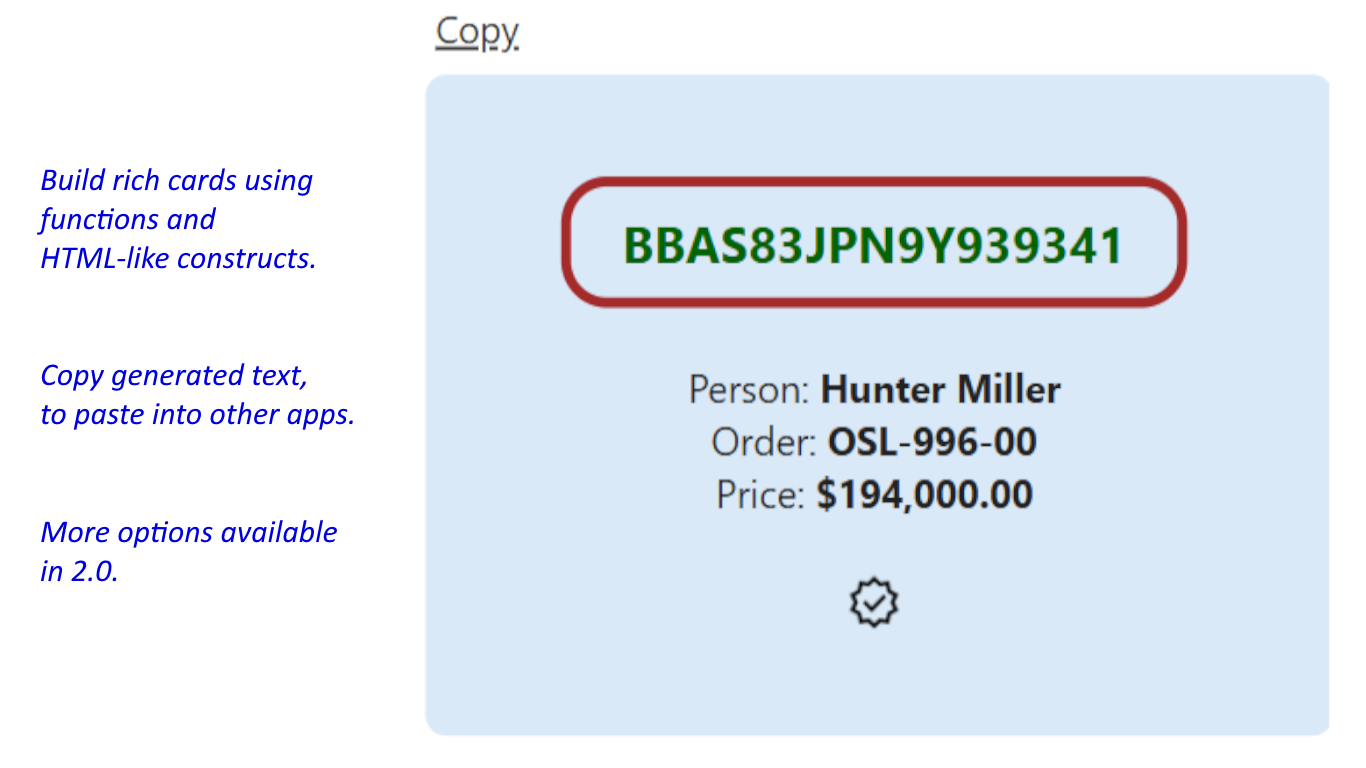
Your rich cards are considered "safe", with data being sanitized for display: the visual is Power BI certified...