Our Visuals

The engine underneath
A chart that fits your data, first try — no charting code to learn. That is RegiaBI, and it runs outside Power BI too.
What RegiaBI doesSelect a Product:

Circle Packing with Auto-cluster
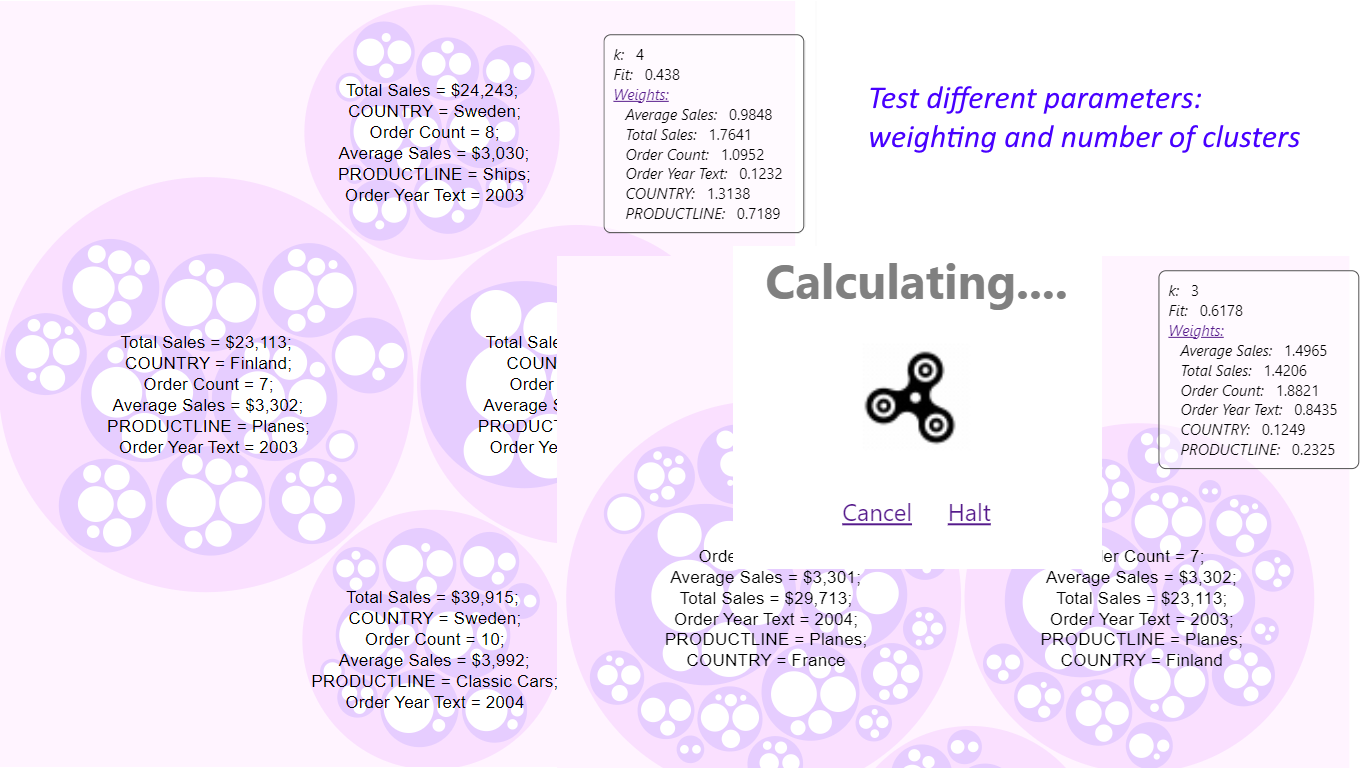
Use unsupervised machine learning to find similarity in your data and render it using nested circles.
Highlights...
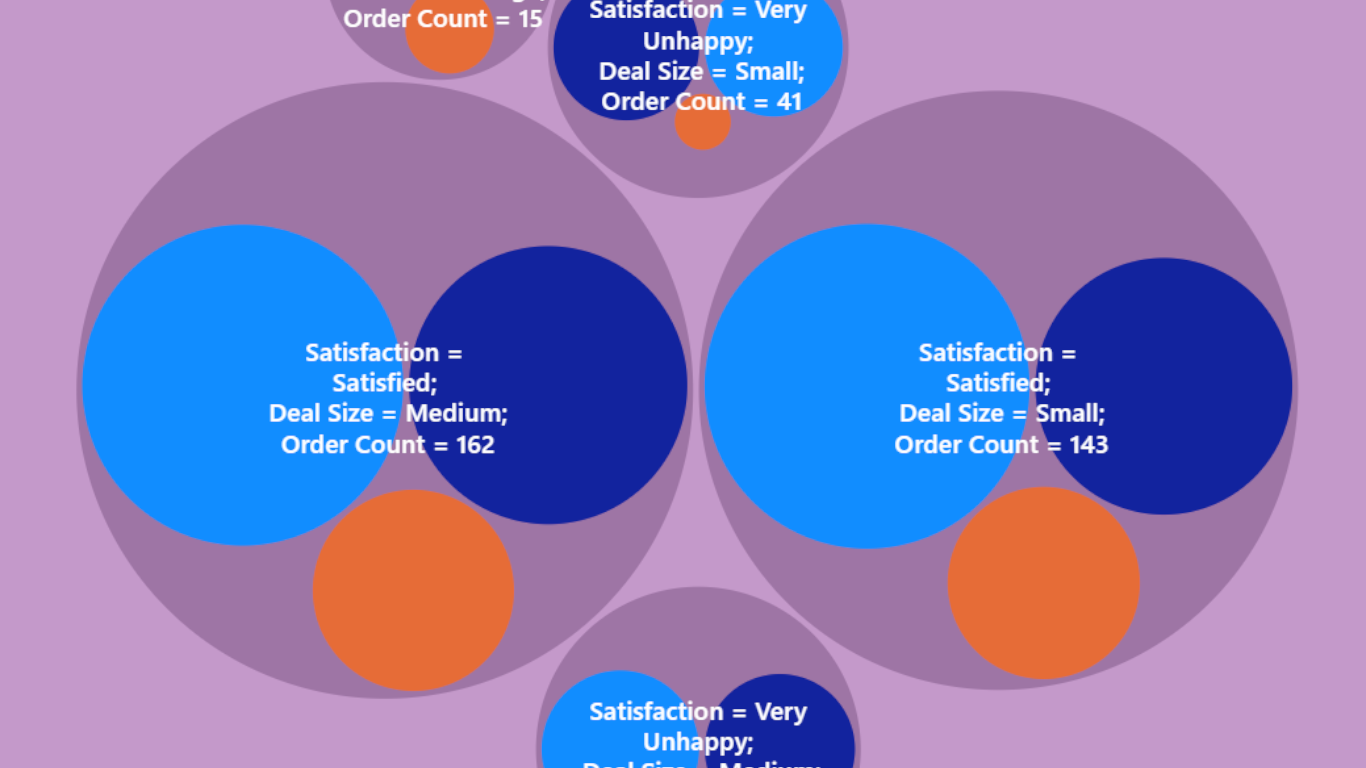
Use numbers, dates, or categorical values (including ordinal values) as features, to detect clusters in your data.
Include user-defined levels of grouping, color medoids to highlight prototypical points, get tool-tips, and much more!
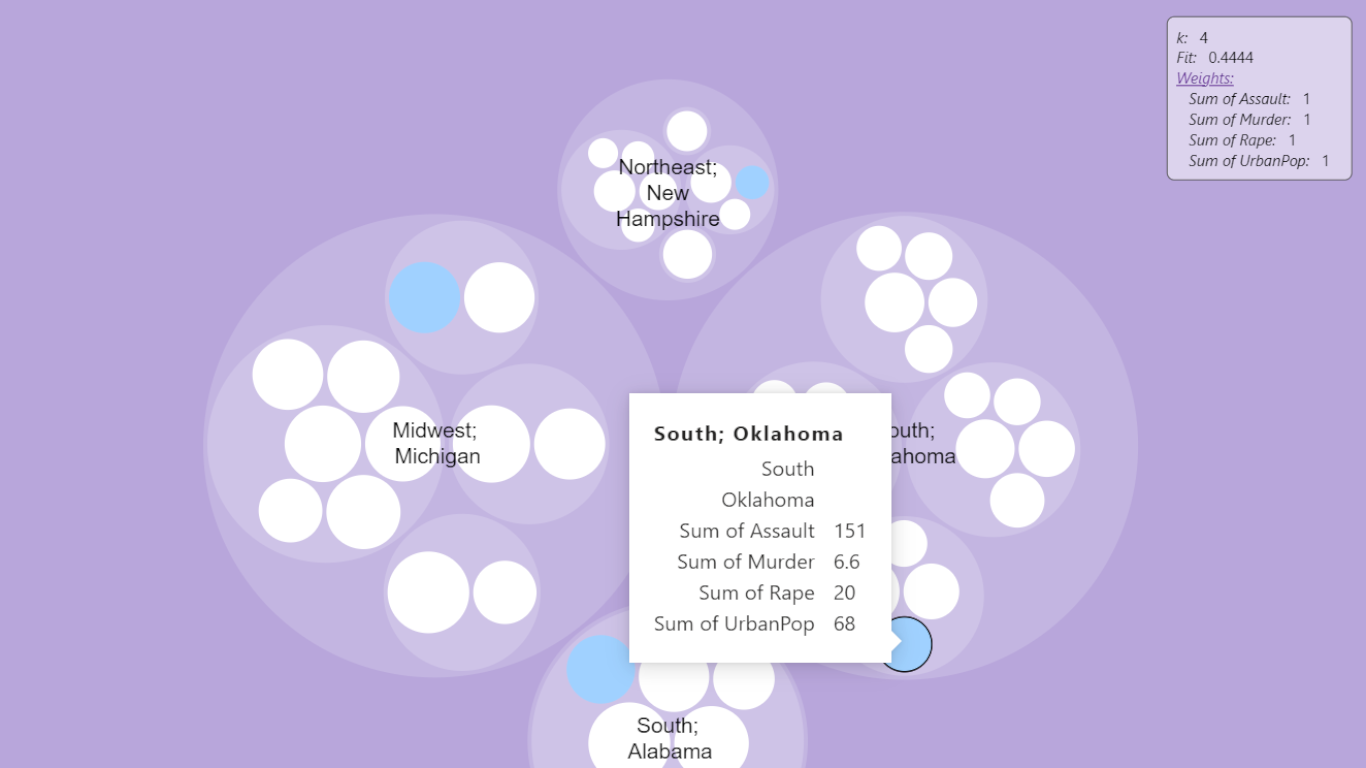
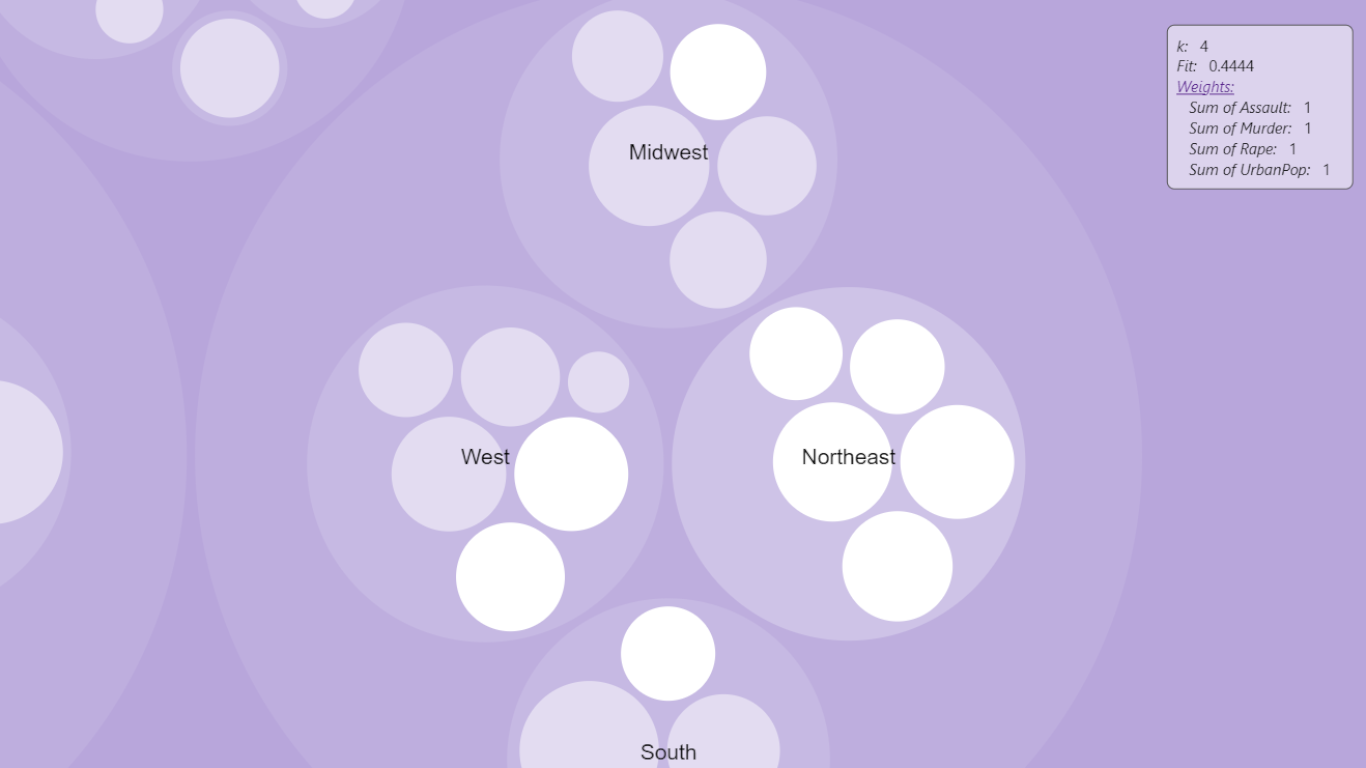
Ability to "zoom in and out" of your circle pack view, plus click on points to cross-filter other visuals (and be filtered by other visuals, too).
Option to use a genetic algorithm to search for model parameters that lead to better quality clusters.