
Gauge
A radial arc showing a value against a maximum the data or the user stated, with the number printed large at the center and an optional target tick on the arc - one dial per value of a bound category, all on one shared scale and every dial drawn or counted, and one dial when nothing splits the rows; a value that is the same on every row is a valid reading.
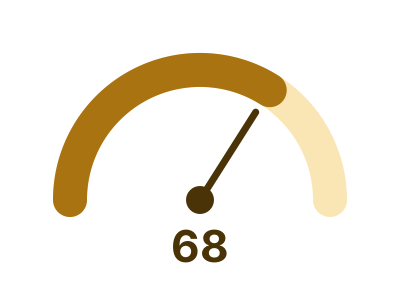
An illustration of the type, not a chart made from data.
The data it needs
A value against a ceiling the data states - a percentage, a rate, or a measure that has a target - overall or one dial per category; a constant value is a valid reading.
Smallest size it draws at: 140 by 140 pixels.
Try it
dataset Try it with Team Quota AttainmentStart with your own data in Power BI or Excel, or build it into your own app through the MCP server. Each one lists the types that fit your data before it builds anything.