
Parallel coordinates
Multivariate visualization with one parallel vertical axis per dimension; each row is rendered as a polyline connecting its value on every axis.
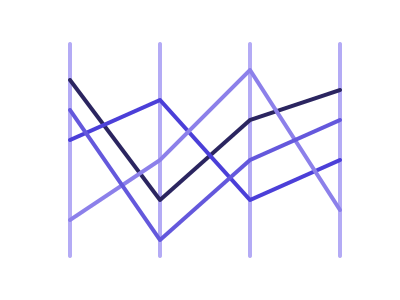
An illustration of the type, not a chart made from data.
The data it needs
Best for 4-8 numeric dimensions and up to ~1000 rows (heavier overlap with more).
Smallest size it draws at: 700 by 480 pixels.
Try it
dataset Try it with Wine Chemistry & RatingsStart with your own data in Power BI or Excel, or build it into your own app through the MCP server. Each one lists the types that fit your data before it builds anything.