
Customer segments
Every customer as a dot, grouped by how recently they ordered, how often and how much they spend into segments the data chooses, each named and profiled, and any group you circle is compared with the rest.
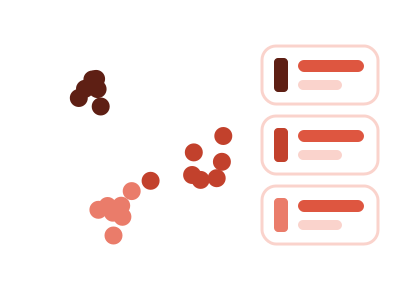
An illustration of the type, not a chart made from data.
What it does
Customer segments draws every customer as a dot on a map of three things: how recently they ordered, how often they order and how much they spend. It groups the dots into segments the data chooses and colors each segment. A card beside the map, or under it on a narrow tile, names each segment and gives its size, its share and its typical values.
A Segments control lets you keep the number the chart chose or set it yourself, from two to eight. Draw a lasso around any group of dots, and a panel compares that group's other fields, such as region or acquisition channel, with the rest.
The chart is plain about weak results. When the groups overlap, the caption says so. When the data shows no distinct groups, every dot is drawn in one color and the chart says there are none. Segments are groups the data shows, not predictions. Clicking a dot cross-filters to that customer, and clicking a card cross-filters to its segment.
When it fits
Use it when you have one row per customer with days since the last order or the last order date, a count of orders and a spend. Other fields such as region or acquisition channel make the comparison panel useful. It's offered from a hundred customers, and asked for by name it's built from 30.
When it doesn't
It needs one row per customer, so a table of orders has to be summarized first. With too few customers it isn't built. It finds groups in recency, frequency and spend only; it doesn't cluster on your other fields.
The data it needs
One row per customer with days since the last order (or the last order date), a count of orders and a spend, ideally with other fields such as region or acquisition channel - at least a hundred customers.
Smallest size it draws at: 294 by 420 pixels.
How to ask for it
Pick Customer segments from the list of what fits your data, or describe it in your own words:
- “Segment my customers by how recently, how often and how much they buy”
- “Show customer segments and let me compare any group I circle with the rest”
Where it runs
- Power BI
- Add the RegiaBI Apps, Maps and Charts visual from AppSource to your report and turn on Lasso Selection in the Format pane, under Interaction, if you want to circle groups. Then bind one row per customer with recency, orders and spend, and pick Customer segments from the list of what fits your data, or ask for it by name.
- Excel
- Get the RegiaBI Apps, Maps and Charts add-in from Home > Add-ins, select a table with one row per customer, and pick Customer segments from the list of what fits. A table of raw order lines is refused, with a message to summarize orders by customer first.
- AI agents
- Add the MCP server to your coding agent with npx -y @bicharts/chart-mcp. The agent asks which types fit your table, generates this one, and gets it as source code for your app.
Customer segments needs a license key, and a free 21-day trial gives you one that works. It isn't offered in free mode.
Try it
Start with your own data: the Power BI visual, the Excel add-in, the MCP server for AI agents. It lists the types that fit your data before it builds anything.
Questions people ask
What data does it need?
One row per customer with days since the last order, or the last order date, plus a count of orders and a spend. It's offered from a hundred customers, and asked for by name it's built from 30. A table of raw order lines is refused, with a message to summarize orders by customer first.
Who decides how many segments there are?
The chart chooses a number from the data, and the Segments control shows it as Auto. You can set two to eight yourself.
Do I need a license?
Yes. Customer segments needs a license key, and the key from the free trial works. It isn't offered in free mode.
Why does it say Preview?
It's available now and still being refined. A preview is built only when you pick it from the list or ask for it by name.