
Seasonal decomposition
Splits one time series into trend, seasonal and residual components in aligned stacked panels.
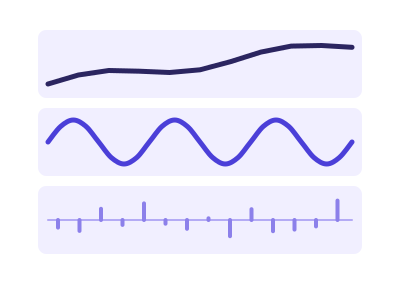
An illustration of the type, not a chart made from data.
The data it needs
Requires a datetime series with one continuous variable and at least two full seasonal cycles.
Smallest size it draws at: 320 by 360 pixels.
Try it
dataset Try it with Retail Store Daily Sales (2 Years)Not in Excel: the add-in draws with D3, and this chart type has no D3 version.
Start with your own data in Power BI or Excel, or build it into your own app through the MCP server. Each one lists the types that fit your data before it builds anything.