
Funnel chart
Ordered, tapering horizontal bars showing how a quantity drops off from one sequential stage to the next, with each stage's width encoding its value and the narrowing communicating conversion/attrition.
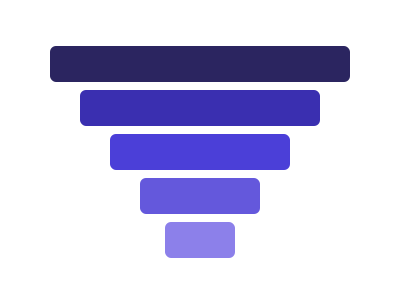
An illustration of the type, not a chart made from data.
The data it needs
Best for conversion/attrition pipelines: signup funnels, sales pipeline stages, checkout flow drop-off.
Smallest size it draws at: 460 by 340 pixels.
Try it
dataset Try it with Department Budget vs ActualStart with your own data in Power BI or Excel, or build it into your own app through the MCP server. Each one lists the types that fit your data before it builds anything.