
Preview
Ternary plot
A triangle whose three corners are three measures sharing a total, with every row placed inside it by how it splits between them - so clusters in the mix are visible at a glance instead of row by row.
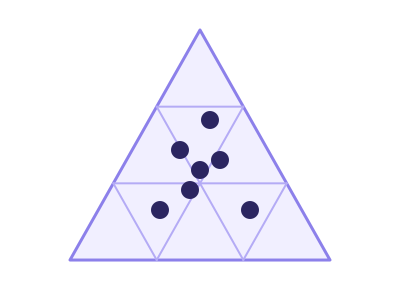
An illustration of the type, not a chart made from data.
The data it needs
Three measures that add up to the same total on every row - product mix, budget allocation, vote share, channel split.
Smallest size it draws at: 294 by 320 pixels.
Try it
dataset Try it with Revenue Mix by AccountStart with your own data in Power BI or Excel, or build it into your own app through the MCP server. Each one lists the types that fit your data before it builds anything.