
Animated World (Bubbles)
One bubble per place on a world basemap, positioned by coordinates or by country, whose size and color animate period by period with play/pause and a scrubber - the place never moves, its measure does.
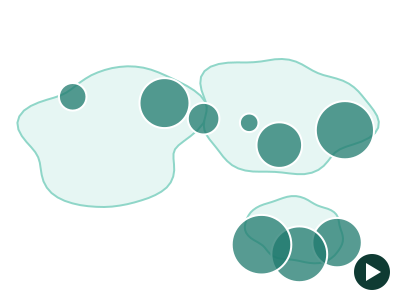
An illustration of the type, not a chart made from data.
When it fits
Use it when the question is how each place changed, not where it ranks today: revenue by country by year, openings by city by quarter, throughput by port by month. Every place keeps its position while its bubble's size and color change period by period, with play, pause and a scrubber to stop on any period. It needs at least three ordered time points.
When it doesn't
Animation is poor at exact comparison: a reader can't hold last year's bubble in mind while looking at this year's. If two specific periods matter, show them side by side instead. With fewer than three periods there is nothing to play, and a long series with many places becomes hard to follow.
The data it needs
Best for a measure per place observed at 3 or more ordered time points - revenue by country by year, openings by city by quarter, throughput by port by month - when the question is how each place changed rather than where it ranks.
Smallest size it draws at: 400 by 320 pixels.
How to ask for it
Pick Animated World (Bubbles) from the list of what fits your data, or describe it in your own words:
- “Animate revenue by country across the years on a world map”
- “Play store openings by city, quarter by quarter”
Try it
dataset Try it with Store Revenue by Country, 15 YearsStart with your own data in Power BI or Excel, or build it into your own app through the MCP server. Each one lists the types that fit your data before it builds anything.