
Gantt chart
One horizontal bar per task spanning its start and end dates on a time axis, grouped by phase, showing schedule and overlap at a glance.
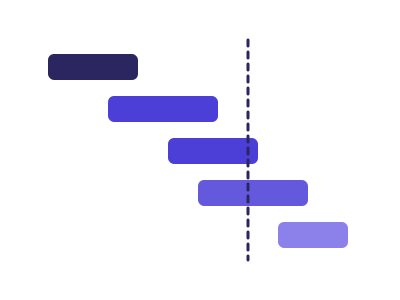
An illustration of the type, not a chart made from data.
The data it needs
Best for project and phase schedules: tasks with a start and an end date, optionally grouped by phase, workstream or owner.
Smallest size it draws at: 420 by 260 pixels.
Try it
dataset Try it with Ocean Shipping Container ManifestStart with your own data in Power BI or Excel, or build it into your own app through the MCP server. Each one lists the types that fit your data before it builds anything.