
Animated bar chart
Horizontal bar chart played over an ordered time dimension - bars re-rank and slide period by period, the classic 'bar chart race'.
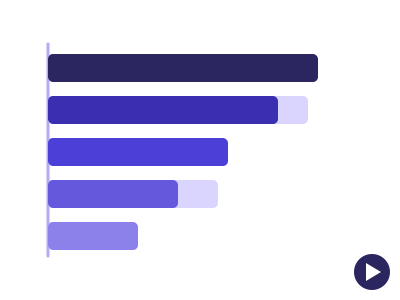
An illustration of the type, not a chart made from data.
The data it needs
Requires one categorical, one measure and a time column with 5 or more ordered periods; best for a leaderboard that changes over time (top products by year, teams by season, countries by decade).
Smallest size it draws at: 294 by 300 pixels.
Try it
dataset Try it with SaaS Subscription Metrics by PlanStart with your own data in Power BI or Excel, or build it into your own app through the MCP server. Each one lists the types that fit your data before it builds anything.