
What-if predictor
Type values for some of your measures and see the range every other measure is predicted to fall in - one linear model fitted on the rows in view, a prediction interval at 80, 90 or 95%, and the share of each measure's spread the values you typed explain.
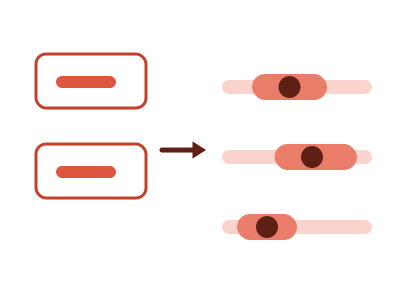
An illustration of the type, not a chart made from data.
What it does
What-if predictor shows one row per measure. You type a value into the box on some rows, which pins those measures. Every other row then shows the range that measure is predicted to fall in, given what you pinned. You choose the confidence of that range: 80, 90 or 95%.
The ranges come from one linear model fitted on the rows in view. The chart names the model and how many rows it was fitted on. Each predicted row prints the share of that measure's spread your pins explain. A row where that share is under a quarter is marked weak and drawn hollow.
The chart says "predicted" and "estimated", and it claims no direction of cause. A value you type outside the observed range is accepted and labeled as outside it. When a filter leaves too few rows to fit, the chart keeps the last fit that had enough and says how many rows are in view.
When it fits
Use it when you have three to ten numeric measures that move together over at least thirty rows, and the question is "if these were X and Y, what would the others likely be?" Stores, products, campaigns and regions by quarter are typical rows. An ordered rating or size, and one category of up to six values, can be pinned too.
When it doesn't
It needs measures that move together; when they barely do, there's nothing to model and it says so. It describes the rows you gave it and doesn't say what causes what.
The data it needs
Three to ten numeric measures over at least thirty rows that move together - stores, products, campaigns, regions by quarter - when the question is 'if these were X and Y, what would the others likely be?'; an ordered rating or size and one category of up to six values can be pinned too.
Smallest size it draws at: 400 by 300 pixels.
How to ask for it
Pick What-if predictor from the list of what fits your data, or describe it in your own words:
- “Build a what-if predictor where I type a price and a size and see the range the other measures would likely fall in”
- “Build a what-if predictor from these store measures”
Where it runs
- Power BI
- Add the RegiaBI Apps, Maps and Charts visual from AppSource to your report, bind three to ten measures, and pick What-if predictor from the list of what fits your data, or ask for it by name.
- Excel
- Get the RegiaBI Apps, Maps and Charts add-in from Home > Add-ins, select your table, and pick What-if predictor from the list of what fits.
- AI agents
- Add the MCP server to your coding agent with npx -y @bicharts/chart-mcp. The agent asks which types fit your table, generates this one, and gets it as source code for your app.
What-if predictor needs a license key, and a free 21-day trial gives you one that works. It isn't offered in free mode.
Try it
dataset Try it with Real Estate ListingsStart with your own data: the Power BI visual, the Excel add-in, the MCP server for AI agents. It lists the types that fit your data before it builds anything.
Watch it built, step by step: What if AI built Excel apps and maps, not just charts?
Questions people ask
What kind of model is it?
One linear model fitted on the rows in view. The range on each row is a prediction interval at the confidence you choose: 80, 90 or 95%.
How do I know whether to trust a row?
Each predicted row prints the share of its spread that your pinned values explain. Under a quarter, the row is marked weak and its bar is drawn hollow.
Do I need a license?
Yes. What-if predictor needs a license key, and the key from the free trial works. It isn't offered in free mode.
Why does it say Preview?
It's available now and still being refined. A preview is built only when you pick it from the list or ask for it by name.