
3D scatter plot
A rotatable cube in which every row is ONE point placed by three continuous measures on the x, y and z axes, with optional color by category and size by a fourth measure. The depth is real: the reader turns the cube by dragging it, and nearer points are drawn larger and more opaque so the third axis still reads in a still image.
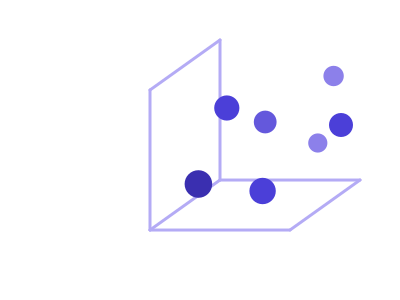
An illustration of the type, not a chart made from data.
The data it needs
Three continuous measures whose joint structure is the question, on a tile large enough to turn. To read exact values off three or more measures, Pair plot (scatter matrix) and Parallel coordinates are both more precise.
Smallest size it draws at: 700 by 480 pixels.
Try it
dataset Try it with Real Estate ListingsStart with your own data in Power BI or Excel, or build it into your own app through the MCP server. Each one lists the types that fit your data before it builds anything.