
Range-compare time series
One measure over time with two draggable range handles, and a strip of KPI tiles above that recompute live for the selected window - its total, the value at each handle, and the percent change between them.
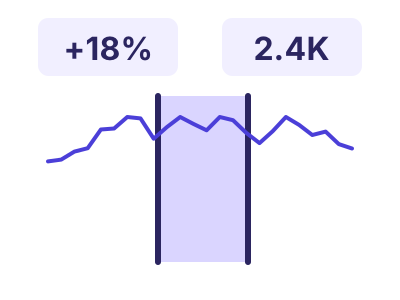
An illustration of the type, not a chart made from data.
The data it needs
Best for a single measure tracked over many dates when the story is a chosen window: drag the two handles to total a period and compare its endpoints, like revenue across a campaign or sensor readings around an incident.
Smallest size it draws at: 480 by 320 pixels.
Try it
dataset Try it with Urban Air-Quality MonitoringStart with your own data in Power BI or Excel, or build it into your own app through the MCP server. Each one lists the types that fit your data before it builds anything.