
Preview
Rotating carousel
ONE sub-chart - a gauge, a line, a bar, a donut, a waffle or a radar - turning through a category's values on a 3D ring, the previous and next values peeking at each side.
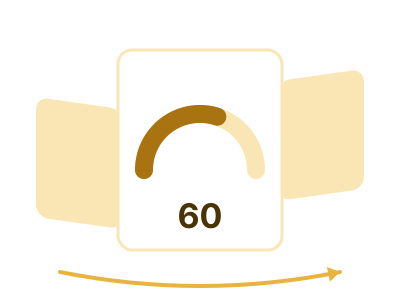
An illustration of the type, not a chart made from data.
The data it needs
Best when each category value deserves its own small chart and the tile has room for only one at a time; the reader turns it, or it turns itself.
Smallest size it draws at: 294 by 200 pixels.
Try it
dataset Try it with Household Expense BreakdownStart with your own data in Power BI or Excel, or build it into your own app through the MCP server. Each one lists the types that fit your data before it builds anything.