
Delta KPI
One headline number beside the value it is being compared with, and the change between them stated twice - as an amount and as a percentage - with the direction shown but colored only when the data says which way is better.
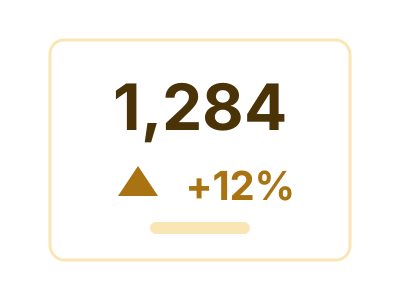
An illustration of the type, not a chart made from data.
The data it needs
Two comparable measures, or one measure at two points in time - this period against last, actual against plan, after against before.
Smallest size it draws at: 200 by 120 pixels.
Try it
dataset Try it with Support Cost by Team, Year over YearStart with your own data in Power BI or Excel, or build it into your own app through the MCP server. Each one lists the types that fit your data before it builds anything.