
World Choropleth
Countries shaded by a measure on a filled world map, revealing geographic and regional patterns across the globe.
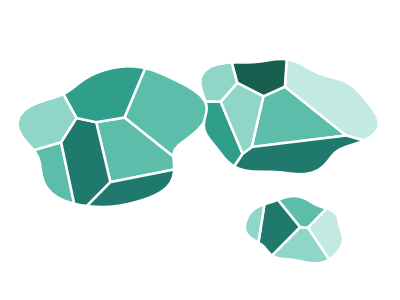
An illustration of the type, not a chart made from data.
When it fits
Use it for one measure per country, keyed by country name or ISO code, when the data covers much of the world: adoption, price levels, growth, or any rate you can compare nation to nation. It shows regional patterns at a glance, such as a measure that is high across one continent and low across another.
When it doesn't
Large countries dominate the picture and small ones vanish, whatever their numbers, and raw totals mostly redraw a population map. Use rates, or bubbles for volume, or the World tile-grid cartogram when every country should count the same. If your countries sit in one continent, that continent's map shows them larger.
The data it needs
Best for country-level metrics: sales, users, or population by country, any measure that varies by nation (keyed to country names or ISO codes).
Smallest size it draws at: 294 by 300 pixels.
How to ask for it
Pick World Choropleth from the list of what fits your data, or describe it in your own words:
- “Shade countries by revenue growth on a world map”
- “Show internet users per 100 people by country”
Try it
dataset Try it with World City Sales — 117 Cities Across 55 CountriesStart with your own data in Power BI or Excel, or build it into your own app through the MCP server. Each one lists the types that fit your data before it builds anything.