
Pareto chart
Categories ranked descending as bars with a cumulative-percentage line on a secondary axis and an 80% reference, exposing the vital few causes behind most of the effect.
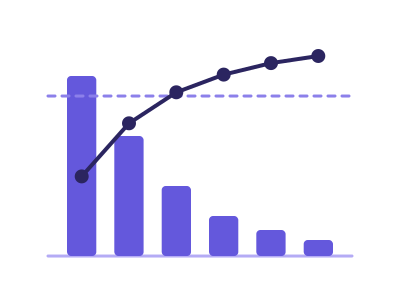
An illustration of the type, not a chart made from data.
The data it needs
Best for finding the vital few: defect/complaint/incident counts by cause, revenue concentration by product or customer (the 80/20 view).
Smallest size it draws at: 320 by 280 pixels.
Try it
dataset Try it with Order Value by Store, Raw Order RowsStart with your own data in Power BI or Excel, or build it into your own app through the MCP server. Each one lists the types that fit your data before it builds anything.