
Connected scatterplot
A scatterplot of two measures whose points are connected in time order, tracing the path the relationship takes over time (with an arrowhead or start/end markers showing direction).
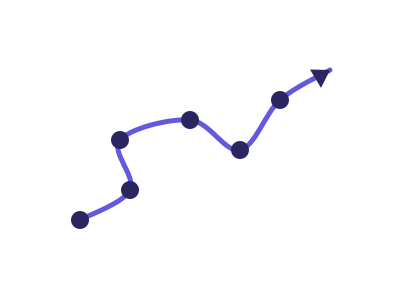
An illustration of the type, not a chart made from data.
The data it needs
Best for the joint trajectory of two related metrics over time (e.g. units vs revenue, unemployment vs inflation) where the path shape is the insight.
Smallest size it draws at: 300 by 300 pixels.
Try it
dataset Try it with Fitness Tracker — Daily Steps, Sleep & Heart RateStart with your own data in Power BI or Excel, or build it into your own app through the MCP server. Each one lists the types that fit your data before it builds anything.