
World (Bubbles)
Each row plotted as a bubble on a world basemap - positioned by its latitude/longitude when the data has them, or by its COUNTRY when it does not - with bubble size encoding one measure and color a second measure or a category.
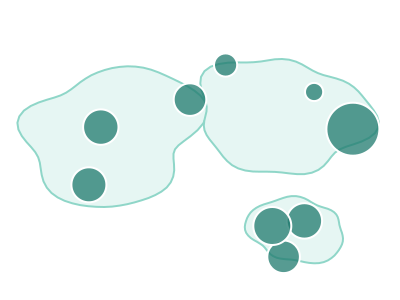
An illustration of the type, not a chart made from data.
When it fits
Use it when your places span more than one continent and volume is the question: offices, shipments, users or revenue. A row with latitude and longitude is placed exactly, and a row without is placed by its country. Bubble size carries one measure and color a second measure or a category, so a small country with a large number gets the visual weight a filled map would deny it.
When it doesn't
At world scale, places in the same region sit on top of each other; if most of your rows are in one continent, that continent's bubble map gives them room. Bubbles compare sizes roughly, not exactly, so for a ranking the reader will act on, pair it with a bar chart.
The data it needs
Best for point or country-level data spanning more than one continent: offices, shipments, users or revenue by country, with a measure for bubble size and optionally a second measure or category for color.
Smallest size it draws at: 294 by 300 pixels.
How to ask for it
Pick World (Bubbles) from the list of what fits your data, or describe it in your own words:
- “Show revenue by country as bubbles on a world map”
- “Plot our offices worldwide, sized by headcount and colored by business unit”
Try it
dataset Try it with Earthquake Locations & MagnitudeStart with your own data in Power BI or Excel, or build it into your own app through the MCP server. Each one lists the types that fit your data before it builds anything.