
Mermaid diagram
Boxes, arrows and labels laid out automatically by Mermaid - a flowchart or process map from source-target rows (with swimlanes from a grouping column), an org tree or mind map from nested categories, or a timeline from dated events.
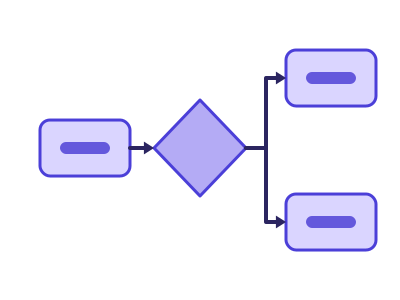
An illustration of the type, not a chart made from data.
The data it needs
A source and a target column (a process, a hand-off chain, a dependency list), two to four nested categories (an org or product hierarchy), or a date beside an event name (milestones, releases, history) - up to a few dozen boxes.
Smallest size it draws at: 360 by 240 pixels.
Try it
dataset Try it with Fitness Tracker — Daily Steps, Sleep & Heart RateStart with your own data in Power BI or Excel, or build it into your own app through the MCP server. Each one lists the types that fit your data before it builds anything.