
Calendar heatmap
GitHub-style grid showing daily values arranged in week/month calendar format with color intensity.
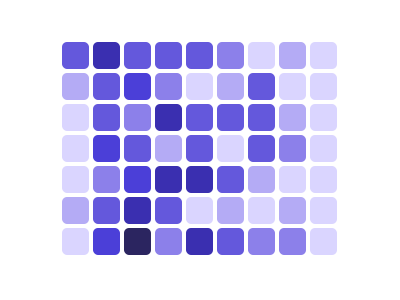
An illustration of the type, not a chart made from data.
The data it needs
Requires daily datetime data with associated numeric values; best for activity/contribution tracking over time.
Smallest size it draws at: 600 by 420 pixels.
Try it
dataset Try it with Fitness Tracker — Daily Steps, Sleep & Heart RateStart with your own data in Power BI or Excel, or build it into your own app through the MCP server. Each one lists the types that fit your data before it builds anything.