
Circular heatmap
Circular heatmap to visualize values in radial layout.
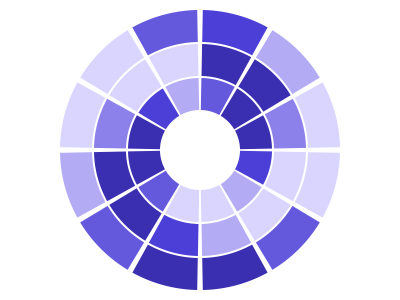
An illustration of the type, not a chart made from data.
The data it needs
Requires two dimensions - a cyclical one such as hour, weekday or month around the angle and a second category or date for the rings - and one measure for the color.
Smallest size it draws at: 294 by 380 pixels.
Try it
dataset Try it with Product Release TimelineStart with your own data in Power BI or Excel, or build it into your own app through the MCP server. Each one lists the types that fit your data before it builds anything.