
Articles & Tutorials
Quick how-tos, deep dives, and hands-on tutorials — watch LLM AI Charts and Maps for Power BI turn data into charts from plain-English prompts.
New articles in your inbox
Drop your email and we'll tell you when we publish something new. No spam — unsubscribe anytime.

Apps, Ontologies and RegiaBI - Oh My! (and a pile of new visualizations)
A status note rather than an essay - the ontology behind RegiaBI is being reshaped by real usage, a wave of new visualizations has landed (most of them still in preview), the Excel add-in is live, keyed visuals are now free and fully automated, and Autocomplete Filter 5.4 is out with 6.0 on the way. Here's where each of those actually stands.

One Does Not Simply Draw a Choropleth
Six geographic chart types shipped in under a week — world and animated world choropleths, USA by state, USA by ZIP-3, and bubble maps for North America and the world. AI can absolutely draw you a map. Getting one that is accurate, that clicks, and that still works on next week's data is the part that can be overlooked, even with AI. Underneath is not a chart library but an ontology for data visualization — RegiaBI, an engine that runs inside Power BI and outside it — which is why a whole class of charts can arrive in days. More coming soon!
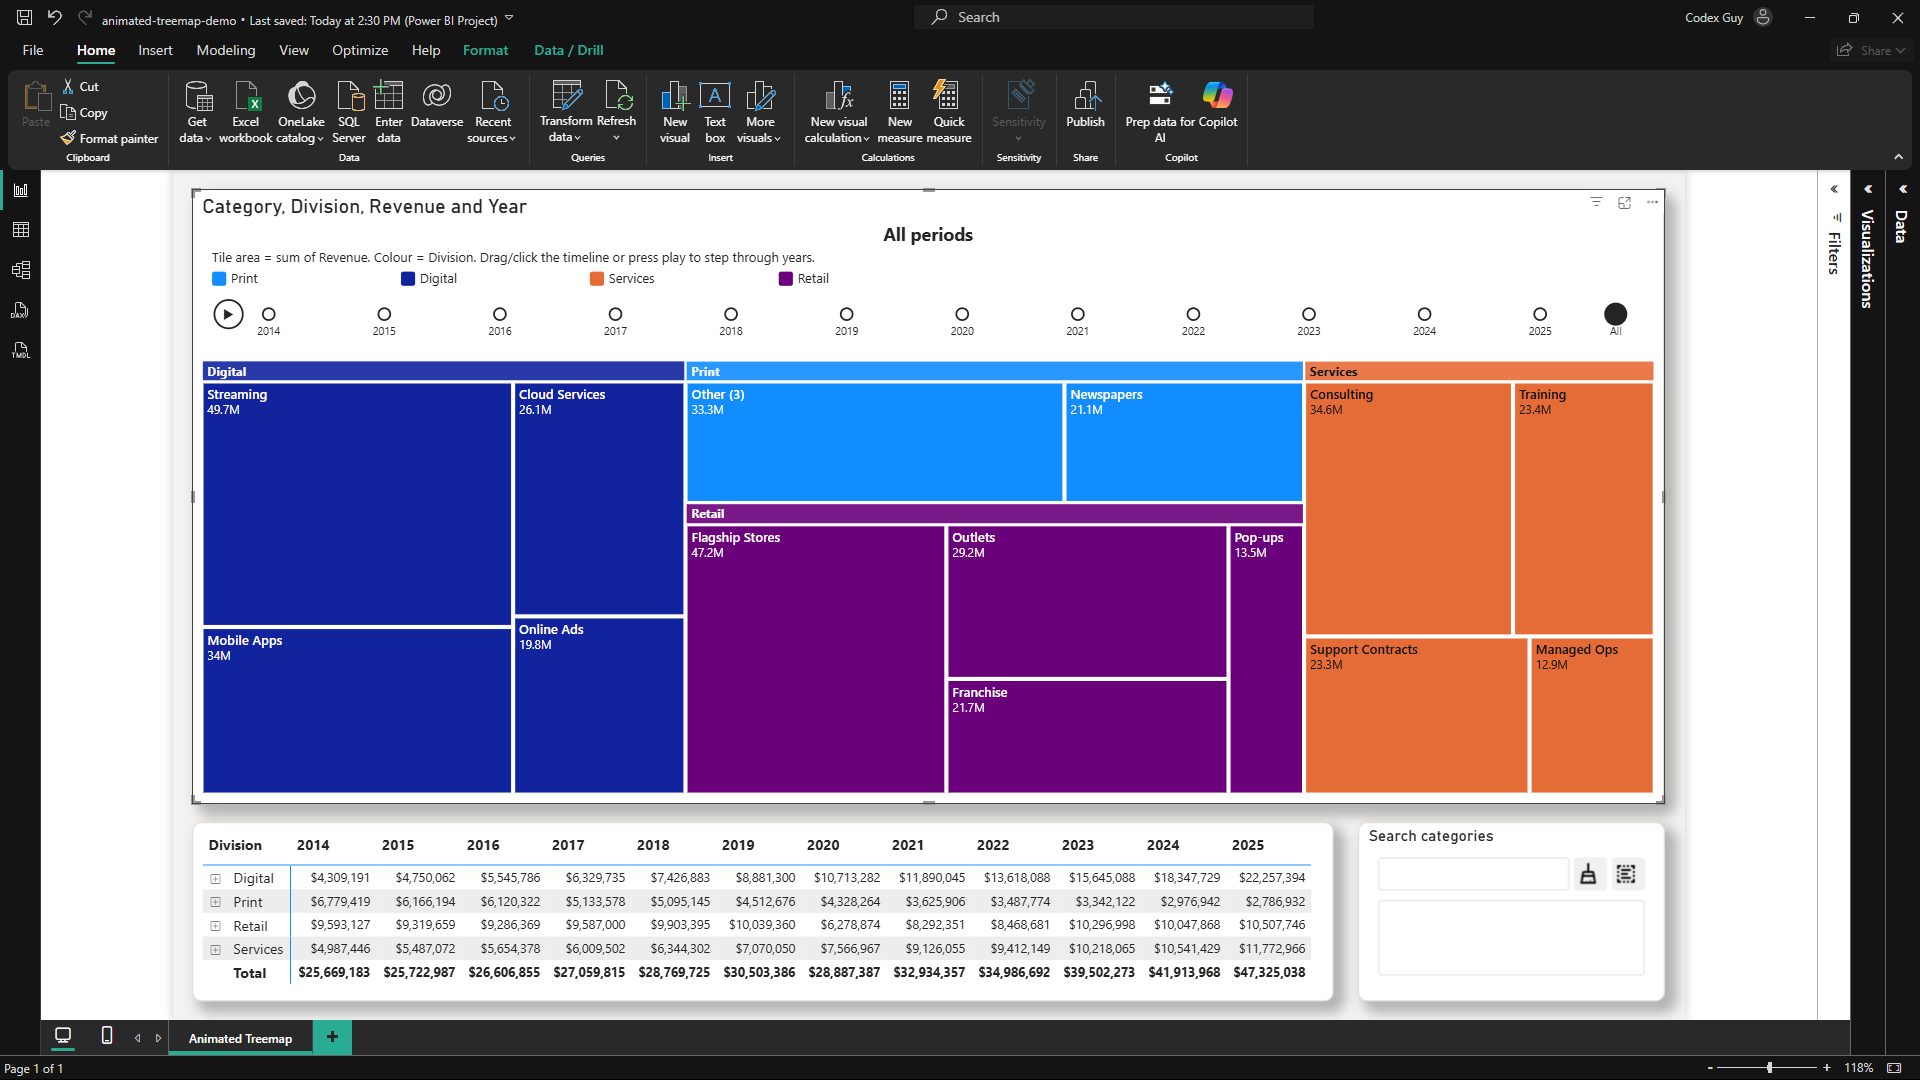
Cracking Power BI Wide Open with D3: The Animated Treemap Arrives
The animated treemap lands in Power BI — a new, fully interactive, cross-filtering chart type built on open D3. Watch it generate in a click, crack open its code, and restyle it in plain English. No custom-visual SDK, no Vega, no separate app.
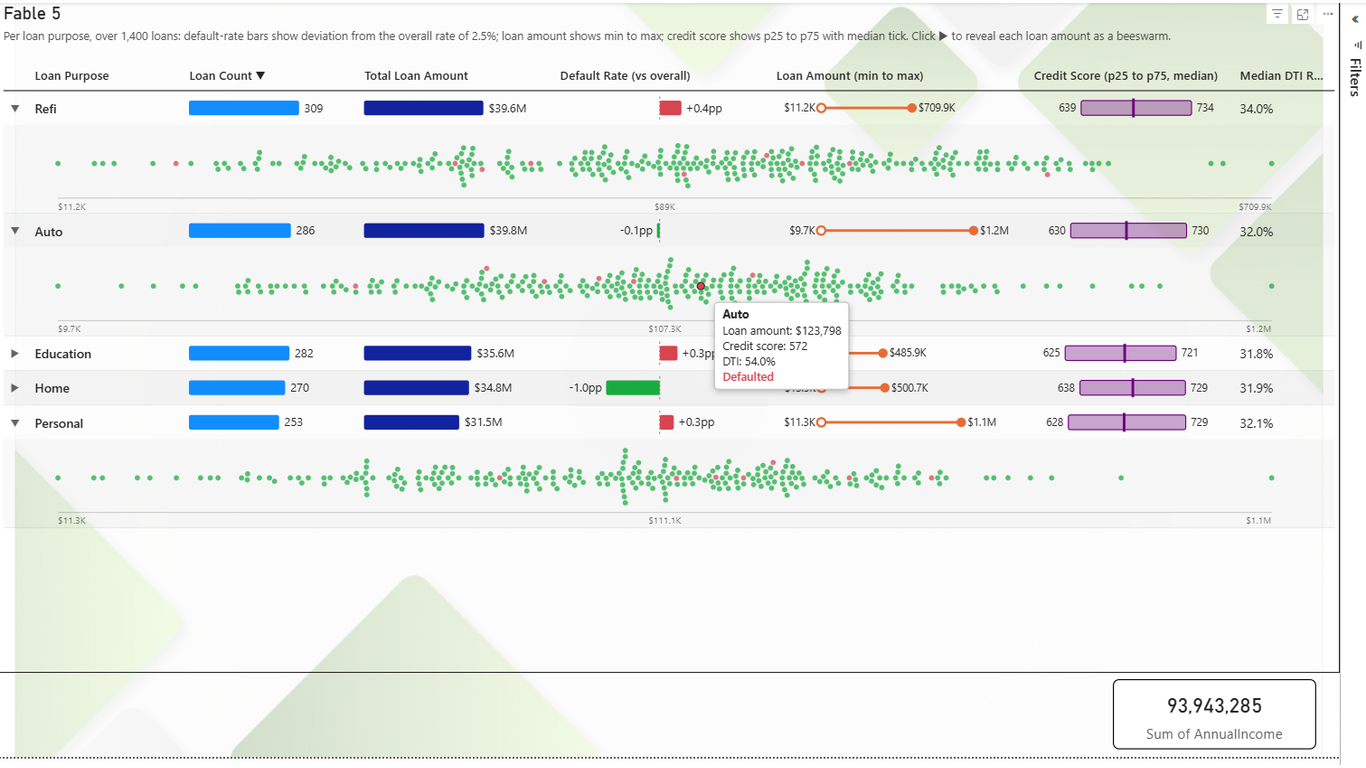
LLM AI Charts v2 meets Claude Sonnet 5, Fable, and the Tabular with Embedded Chart Type
We put five LLMs — GPT-5-mini, Claude Sonnet 4.6, Sonnet 5, Opus 4.8, and Fable — through a zero-code bake-off, building interactive Power BI tables with embedded mini-charts. Cross-filtering included. Code optional — and when you do open it, AI helps you finish.