

Make Generative AI for Data Apps and Maps Better.
A what-if projection with its controls inside the chart, a bivariate map with its two-way key — for Power BI, Excel, Fabric Apps and the web, with selection and cross-filtering already wired.
These are AI Data Components: small interactive applications disguised as chart types, alongside flow maps and everyday bars and lines. Describe what you want, or just hand over the data, and RegiaBI fits one to your whole result, not a sample, and returns it as source you own: a solid starting point to adjust, without learning D3, Vega, or anyone’s charting API. Writing code has become cheap for an AI; getting the behavior right hasn’t, and that’s the part RegiaBI brings. It's the engine behind RegiaBI Apps, Maps and Charts.
Nobody wants to learn a charting library. They want the chart.
The old ways all tax you the same way: weeks inside D3 or Vega-Lite, HTML tricks bent around a content control, or settling for whatever the stock charts can manage. Every chart beyond the basics becomes its own small engineering project — before you have learned anything from your data.
RegiaBI’s answer is a chart that's already right: correctly shaped for your data on the first try.
What that really buys is position. Instead of starting at an empty canvas and building toward something usable, you start with a chart that already works — interactive, cross-filtering, laid out, labelled — and spend your time on the last ten percent: the tweak at the edges, the emphasis, the thing only you know about your business. Days of scaffolding that never made the chart better are simply gone.
And you keep adjusting the same way you started: in plain language. If you do read code, the generated source is right there and yours to edit — a real advantage, and never a requirement.
Because the engine knows what nearly ninety chart types can honestly say, it will sometimes hand you a view of your data you had not considered — or measure something you had not thought to measure. That's the part no charting library can offer at any price: a library waits for you to know what to ask.
Why this exists
How many times has AI handed you a chart you couldn’t use?
It invents a number that was never in your table. It stacks two labels into an unreadable smear. It reads a rate as a count, or a year as a quantity, and draws something confident and wrong. Usually you can tell at a glance that it's wrong — what you cannot do is tell it why, or have any reason to trust the next one more than the last.
That frustrated me too. Enough to stop treating it as a prompting problem, and go build an ontology layer instead — a formal description of what each chart type genuinely requires, so that “this chart cannot honestly show your data” becomes something a machine decides, rather than something a model can be talked out of.
It's bearing fruit. The outcomes get better daily.
Is it perfect? No — and I would rather say so here than have you discover it on your own data. But it does improve by experience, in a literal sense: every failure worth the name becomes a scoped rule or a hard gate, and before any of those ship they are replayed across every chart the engine has ever generated — thousands of them — to prove the fix catches what it claims and breaks nothing that already worked. That corpus only grows. So the floor keeps rising, and it does not drop back when the model underneath changes.
— Joel Champagne, CodeX Enterprises
How the first try earns your trust
Four stages, in this order
“First try” is a strong claim, and the note above is why it needs defending rather than asserting. These four stages are what stands between subtly-wrong chart code and you. The numbering is the actual sequence.
Read the shape
The data is profiled first: measures and dimensions, cardinality, analytical grain (is a row an observation, or already a summary?), temporal structure, geographic content, whether a measure is a rate that must never be summed. Measurements, not guesses.
Decide what fits
An ontology describes close to ninety chart types formally — what each requires, on which channel, of which data type. A type your columns cannot honestly support is excluded, not ranked low. The rest are ordered by fit.
Generate against a contract
The model gets the shape, the chosen type’s channel contract, and rules earned from real failures — each scoped to the chart families it applies to, so a rule about polar axes never reaches a bar chart. It writes real code in a real library, not a config blob.
Verify, then hand it over
The result is executed, statically checked and measured: does the legend match what was painted, does it survive a small viewport, does interactivity bind to real rows. Failures are repaired or reported — never assumed to have worked because they returned.
Exclusion, not ranking
A chart that cannot be honest is not offered
Most tools rank every chart type and let you pick a bad one. RegiaBI removes the ones your data cannot support: no distribution chart for a table that is already aggregated, no part-to-whole for a measure whose parts do not sum to the whole.
Geography is the case that makes this concrete. Six different map types need six different things — and a column of country names isn't the same input as a column of ZIP prefixes.
One does not simply draw a choropleth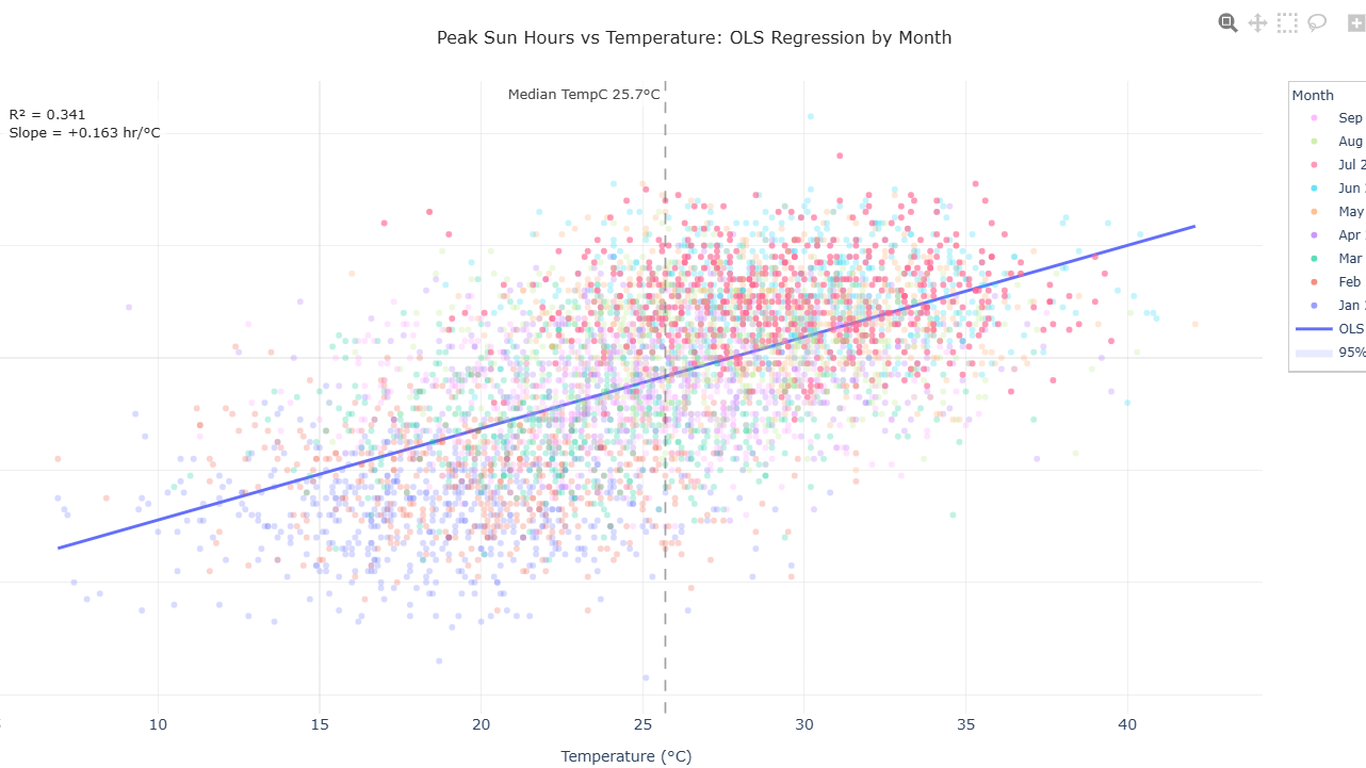
Verification
The chart is measured, not merely returned
Generated code is executed before you see it. Legend entries are compared against what was actually painted, the layout is re-measured at small viewports, and interactive elements are checked for a binding to real rows rather than array positions.
When a check fails, the fix becomes a rule scoped to the chart families it belongs to — so it holds for every chart after it, without leaking into charts it has nothing to do with. That's why the model can be swapped and the standard does not move.
Five models, one standard: the bake-off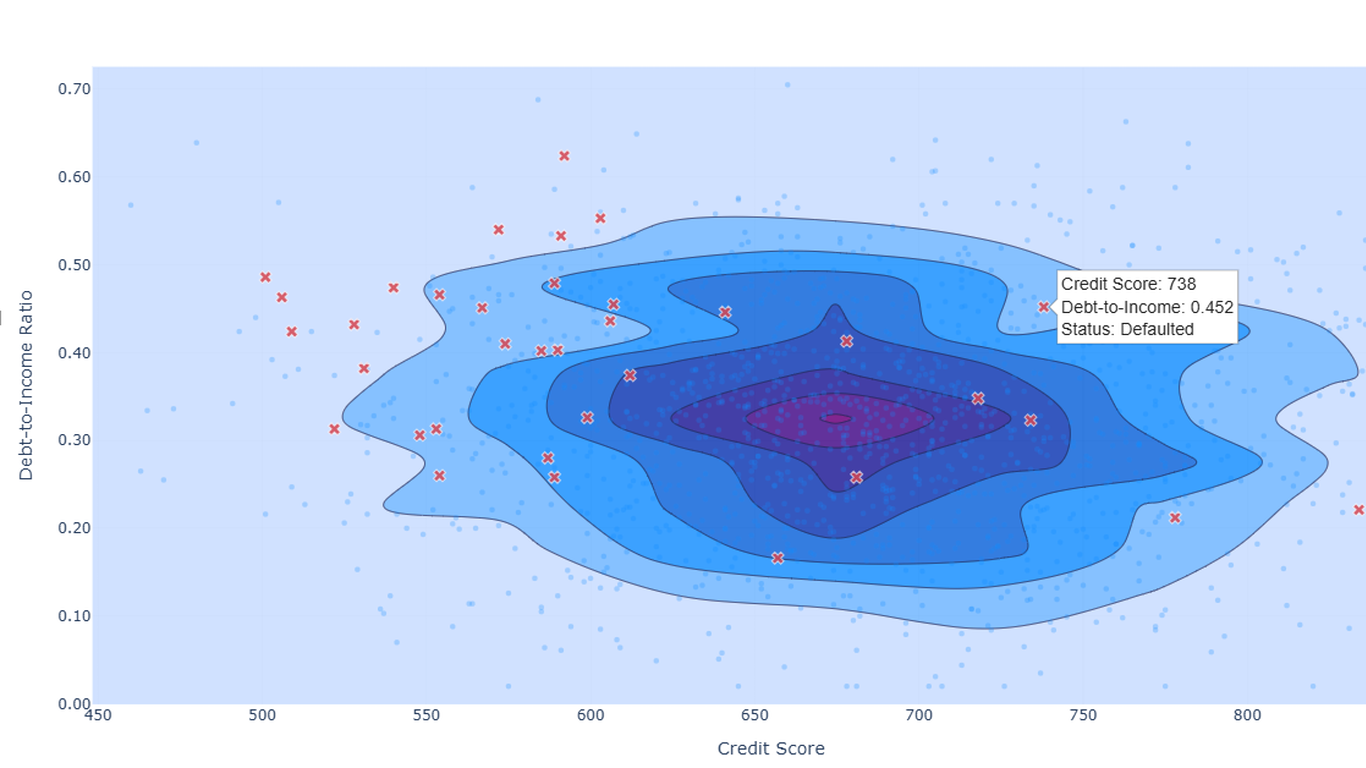

Why that name
Aqua regia — royal water — dissolves gold
It's a mixture of nitric and hydrochloric acid, and it's named for what it does: it dissolves the one metal that resists nearly everything else.
Neither acid can do it alone. Nitric acid is the powerful one, but on gold the reaction stalls almost immediately. Hydrochloric acid cannot start anything at all — it binds the product away as fast as it forms, pulling the reaction forward instead of letting it stop. Neither reagent is the clever one. The clever thing is the loop between them.
That's the design. The model is the only thing that can judge what would actually tell you something; alone, it drifts. The deterministic layer invents nothing, but it locks down each correct result and takes a failure mode out of circulation — so a defect fixed once stays fixed.
The mark is that reaction: a data drum cast in gold, coming apart from the bottom. What dissolves is the old way of getting a chart — not your data.
Where it runs
One engine, more than one front end
Power BI
RegiaBI Apps, Maps and Charts for Power BI is the engine’s front end in a report: prompts in, an interactive visual out, cross-filtering the rest of the page. Where most people meet it, and unchanged by any of this.
Your own app
RegiaBI hands you a chart that fits your data on the first try, as source you own, and it runs in your React app or any web page on a free, open-source runtime with no call back to us.
Elsewhere
The rendering and shape-analysis pieces are host-agnostic by construction. That's what makes new surfaces possible at all, rather than a rewrite each time.
Questions
Frequently asked
What is an AI Data Component?
A finished, interactive piece that an AI fits to your data: a what-if app with its controls inside it, a table a reader sorts and searches, a map, a KPI card, or a chart. What makes it a component and not generated code is that its behavior arrives built and tested — selection, cross-filtering, sizing, dark mode — and is the same in Power BI, Excel, a Fabric App or a web page. The AI chooses the piece, binds your columns and writes the part that is specific to your data; it doesn't reinvent the rest each time.
How does RegiaBI relate to RegiaBI Apps, Maps and Charts?
RegiaBI is the engine; RegiaBI Apps, Maps and Charts for Power BI and for Excel are the products you install that run on it (they were named LLM AI Charts and Maps until November 2026). The engine does the shape analysis, the chart selection, the rule corpus and the verification. Naming it separately is what lets the same engine appear in places that are not a Power BI report or a workbook.
Do I need Power BI to use it?
No. The Power BI visual is one front end. The engine is also reachable over an HTTP API and as an MCP server, which is how a coding agent or your own application can use it directly.
What actually leaves my environment?
Column names, a statistical profile of the data, and — depending on the privacy setting you choose — sample rows, plus any prompt text you write. Generation calls pass that on to a third-party language model provider. The specifics, including what is logged on our servers and the categories of data you must not send, are set out in the RegiaBI Apps, Maps and Charts Terms and the RegiaBI Programmatic Access Terms.
Which chart libraries does it generate for?
D3, Plotly, matplotlib and Vega. The choice of library changes the code that is written and the rules that apply to it — a rule about artist hygiene reaches matplotlib and nothing else — but not the shape analysis or which chart types are eligible.
What happens when the model writes bad code?
It's caught before you see it, or it's reported. Code is executed and statically checked; the rendered output is measured against what the code claimed to draw. Deterministic defects are patched outright, the rest go back for repair, and a failure that recurs becomes a scoped rule so it stops recurring.
Does calling the API require a license?
Yes. Programmatic access — the API and the MCP server — requires an active license on your account; there is no free tier for it, and the evaluation allowance inside the Power BI visual does not extend to it. Asking “what fits?” inside the visual remains free. See the Programmatic Access Terms.
An organizational license you already hold counts. If your org licensed any of our visuals, that same active license opens programmatic access — it's not a separate product to buy, and the licensee name and key you already have are the ones the API expects. It pairs well with a monthly subscription: the license keeps the door open, and generation draws on your account’s usage credits only when you actually generate.
Is any of it open source?
Parts of it. The host-agnostic rendering and shape-analysis packages are published openly, under the license distributed with each package. The engine itself — the ontology, the eligibility rules and the rule corpus — is not.
Is support included?
Yes — a paid subscription includes direct support from the people
who build the engine. Setting up the MCP server, signing in, a call that
fails or a chart that didn’t come out the way you expected: open a
ticket on the support page or email us, and quote
the correlationId from the result if you have one. A license
you already hold for one of our visuals includes it too.
I already have a license key. Does it work here?
Yes — the same licensee name and key authenticate programmatic calls, and they are on the Keys tab of your account. If you also enable a client secret, calls must carry that too.
More on how the pieces were built — and what broke first — in the articles.
Put the engine where your work already is
Inside the Power BI visual, asking “what fits?” stays free. Programmatic access needs an active license: the eligibility call is free within an hourly allowance, and beyond that it draws on your account’s usage credits, the same way generation does. A paid subscription includes direct support from the people who build the engine.
And if your organization already licenses one of our visuals, that's the license — nothing further to buy to start calling the engine directly.
RegiaBI is a product line of CodeX Enterprises LLC. About · info@bizintelligencechampions.com