
This is the written companion to this video. The video moves quickly, so here's each of its three examples again, slower, with the numbers on the screen, the exact requests I typed, and other details that were too much for the video.
Where we left off
In the September update I said it was time to stop talking about "chart types". A tile that asks you for a value and answers back isn't a picture of your data anymore: it's a small app, and I said to expect more of them. In the same update the Excel add-in went live, with the goal of parity with Power BI rather than a cut-down cousin.
Since then the Fabric Apps write-up showed the same engine carrying an AI agent's web app through MCP. This piece goes back to Excel, which is a key surface for millions of people, on a daily basis.
The product names have moved with it. What the September update called LLM AI Charts and Maps is now RegiaBI Apps, Maps and Charts for Excel (and for Power BI). Apps come first in the name because they're the part that's new. I've started calling the whole set AI Data Components: charts, maps, tables you work with, and small apps, all built for your data by the same engine.
The three datasets, so you can follow along
Every table in the video is a free download. They're small, load as they are with no cleanup, and each one
is shaped for the component it's used with here. (The customer table has a few blank Channel and
Discount % cells on purpose; the components handle them.)
| Dataset | Rows | Columns | Used for |
|---|---|---|---|
| NBA Shot Locations | 2,200 shots | ShotX, ShotY (the position on the court), Made (1 or 0), Quarter, Team (Home or Away) |
the shot chart |
| Customer Spend and Support Tickets | 400 customers | Customer, Region, Plan, Channel, Tenure (months), Support Tickets, Support Hours, Monthly Spend, NPS, Discount % |
the selection explainer |
| Real Estate Listings | 680 listings | ListingID, Neighborhood, PropertyType, Sum of Sqft, Bedrooms, Bathrooms, AgeYears, Sum of ListPrice |
the what-if predictor |
The real-estate columns really are called Sum of Sqft and Sum of ListPrice, which is why the chart
labels them that way. Rename them in the sheet before you generate if you'd rather see "Square feet" and
"List price".
Loading one into Excel:
- Download the CSV.
- In a blank workbook, choose Data > From Text/CSV, pick the file, and choose Load. Excel puts the rows on a new sheet as a table, with the first row as headers. That's how I loaded all three. (Opening the CSV directly also works, but it leaves a plain range, not a table.)
- Add the add-in (next section). Then select the table, or any range of it with its header row, and choose Menu > Use selection. The pane says what it's bound to, for example "nba_shot_locations!A1:E2201 - 2200 rows", and the list of types that fit opens by itself.
If your Excel uses a comma for decimals, numbers like -21.09 can import as text. In that case choose
Transform Data instead of Load, select the number columns, choose Data Type > Using Locale,
pick Decimal Number and English (United States), then Close & Load.
All three are also on the datasets page, with the rest of the collection.
Getting set up
Everything below starts the same way, so here it is once.
- Install the add-in. In Excel, choose Add-ins on the Home tab and search for RegiaBI. The listing can still show the old name for a while; the search finds it either way. Choose Open.
- Point it at your data: select a table or a range with a header row, then Menu > Use selection. My three examples are each a single table on a sheet, loaded as described above.
- Check what's sent, if you're curious. See what's sent shows the exact request before anything leaves. It's the measured shape of your table (column headers, the type of each column, summary statistics and a few short category labels), not your rows, and that stays true for as long as you work with the chart. The chart's code runs locally, in Excel, against your rows.
- Link your account. Choose Link your account and sign in at bizintelligencechampions.com. Creating an account is free and starts a 21-day trial.
After that, the add-in reads the table and lists the chart types that genuinely fit it. That list is the first guardrail: it's different for every table, because it's decided from the table's characteristics, not from a menu.
1. A shot chart, then two requests in plain English
The first table is 2,200 shots by a hypothetical basketball team: a court position (ShotX, ShotY),
whether the shot went in (Made), the quarter, and whether the team was home or away.
The usual route in Excel. There's no built-in chart that bins two coordinates into a grid. You'd bin
them yourself (a FLOOR on each coordinate and a COUNTIFS grid), color the grid with conditional
formatting, and then hand-draw a court over it with shapes that don't move when the grid does. A home/away
switch is a slicer or a second sheet. All doable, all manual, and none of it survives a column changing.
What I did instead. The add-in listed 52 types that fit this table. The coordinates suggested a map of where shots come from, so I picked Binned 2D heatmap and chose Generate. The first draw counted shots per bin in gray. If you know basketball, you can already see the basket and a rough three-point arc in where the shots cluster.
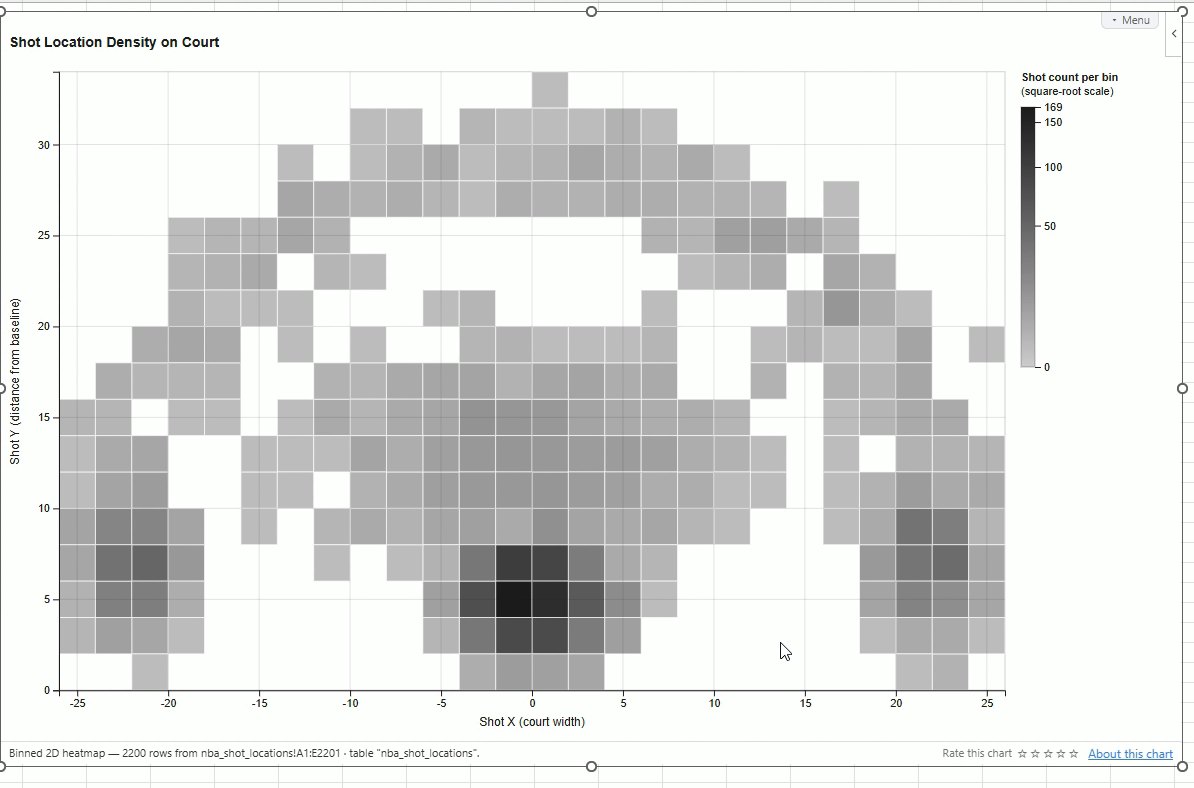
Then I chose Adjust and typed what I wanted changed:
use a blue color scale, showing percentage made. draw standard court lines including the 3 point circle, free-throw, restricted circle, and the hoop, at the correct locations
A couple of minutes later both requests were met: the color now encodes the share of shots made in each bin, and the court is drawn on top at the right positions. It also had working tooltips, which I hadn't asked for. So I asked for one more thing:
add a set of buttons on the far bottom right that allow filtering by Team (Home, Away, All).
That added Home, Away and All buttons to the chart itself, and clicking them redraws the court for that subset.
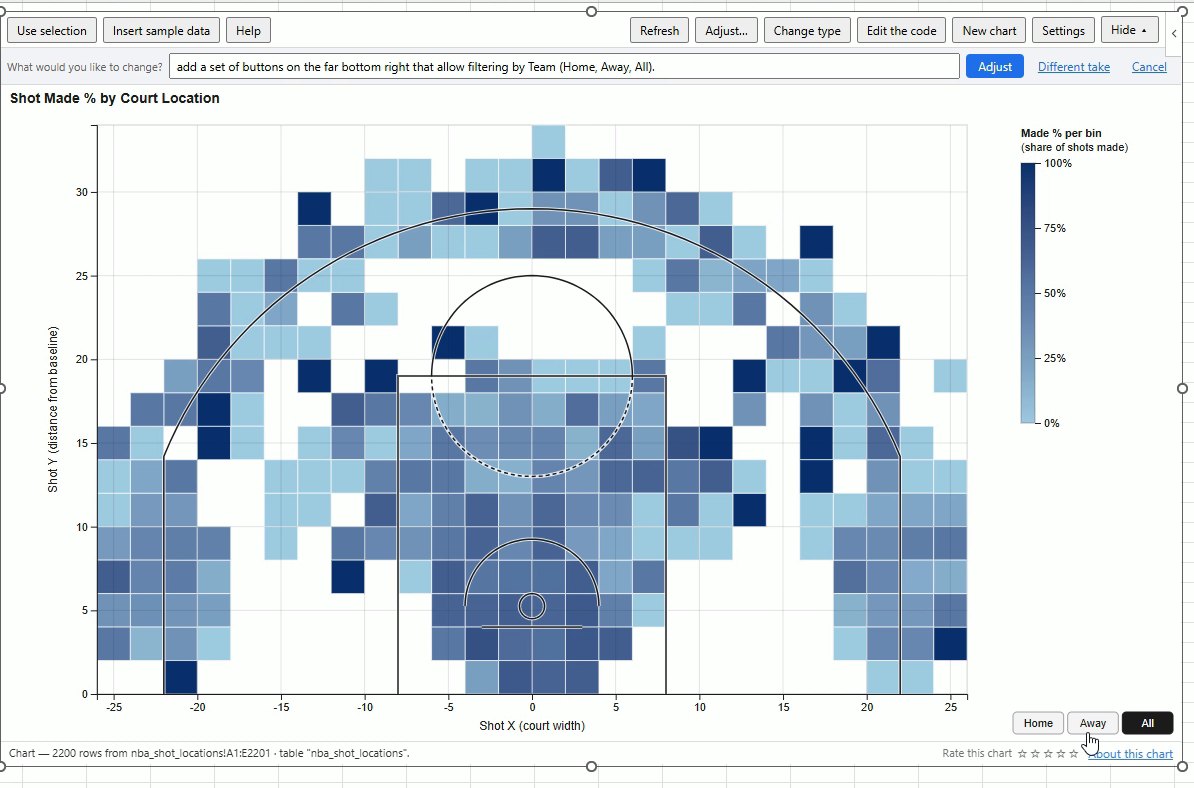
So what did that build? A small application inside Excel, on live data, that started from a recipe known to work for this shape of data and was then made my own in plain language. The Adjust step is the same in Power BI. Each request changes the chart's code; the data never leaves the sheet.
2. Where those types come from: the AI Gallery
A shot chart is still a chart. The next two examples aren't, which is why I took a short detour through the AI Gallery in the video. It shows every component the engine can build (137 as I write this), grouped as mini-apps, tables, maps, KPIs and cards, and charts, each with a "Try it with" dataset.
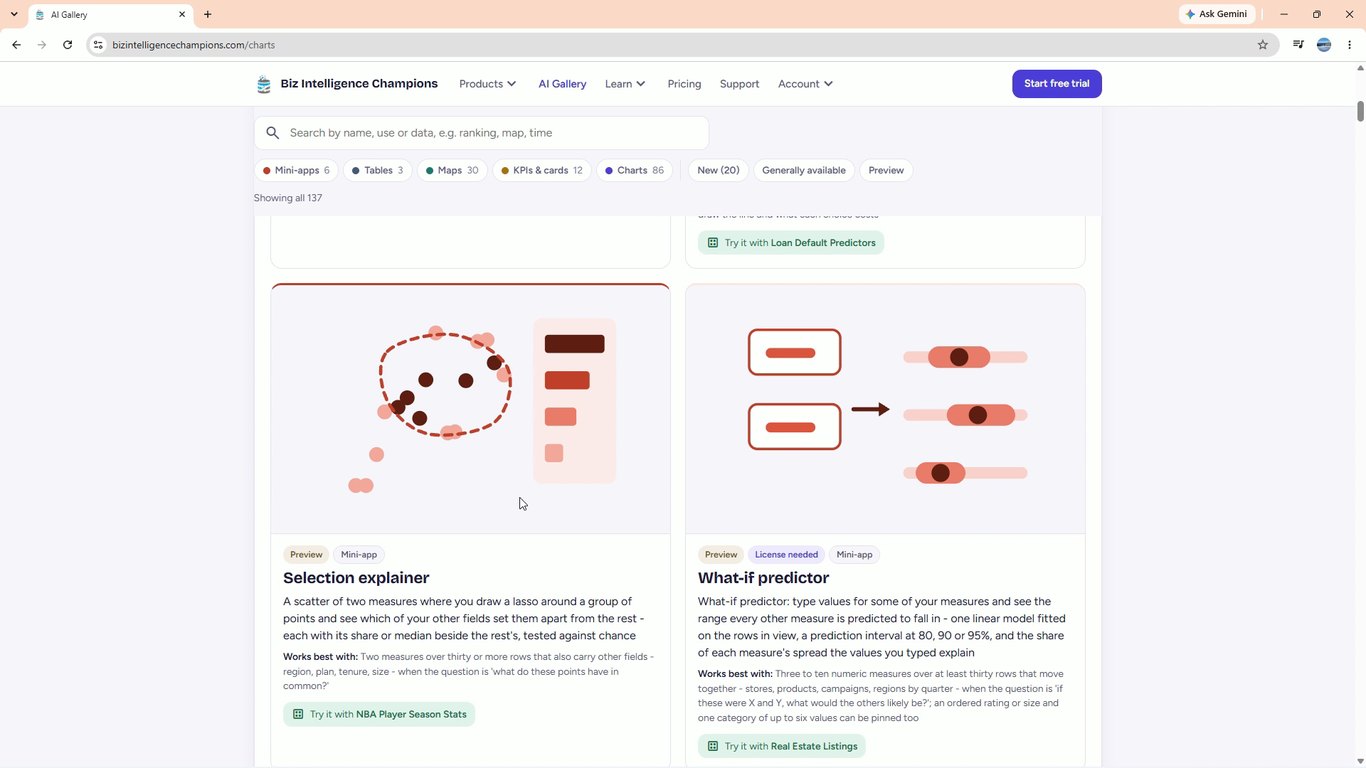
The point of a catalog, rather than asking an AI to "build me anything", is that every entry has been made to work on the first try for the data it accepts, and refuses the data it doesn't. Ordinary AI will write you a widget too. What it usually won't do is tell you the widget doesn't suit your data, or that its answer could be chance.
3. The selection explainer: who keeps support busy?
The second table is 400 customers: region, plan, channel, tenure, support tickets, support hours, monthly spend, NPS and discount. It's a different shape, so the add-in listed a different set: 65 types fit. I picked Selection explainer.
It draws a scatter (support hours across, support tickets up, colored by region) and lets you draw around any group of points, with a lasso or a rectangle. The question I wanted answered: who are the customers who keep support busy?
The usual route in Excel. Filter to the busy customers, build a pivot of each other column for that group and for everyone else, and compare by eye. It works, but it has a trap that's easy to miss: compare enough columns and something will look different by chance alone. Nothing in a pivot tells you which differences are real.
What it showed. I drew a rectangle around the top-right corner: 9 of 400 customers.
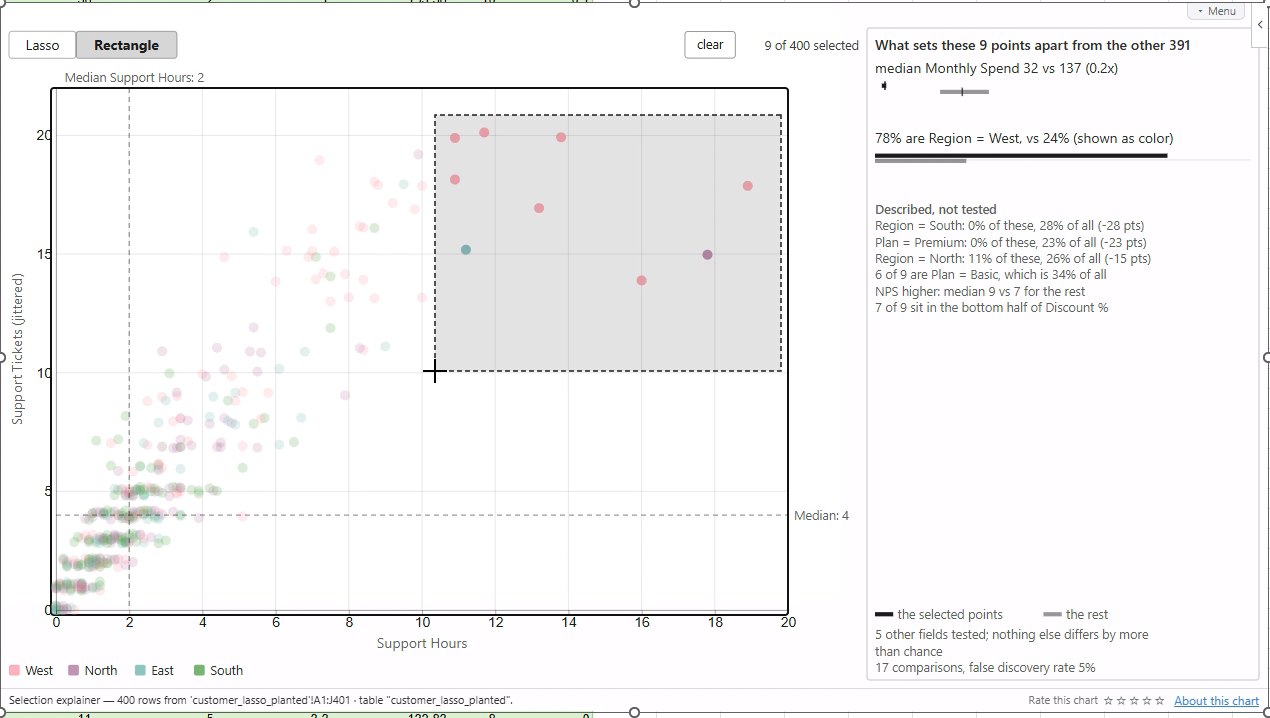
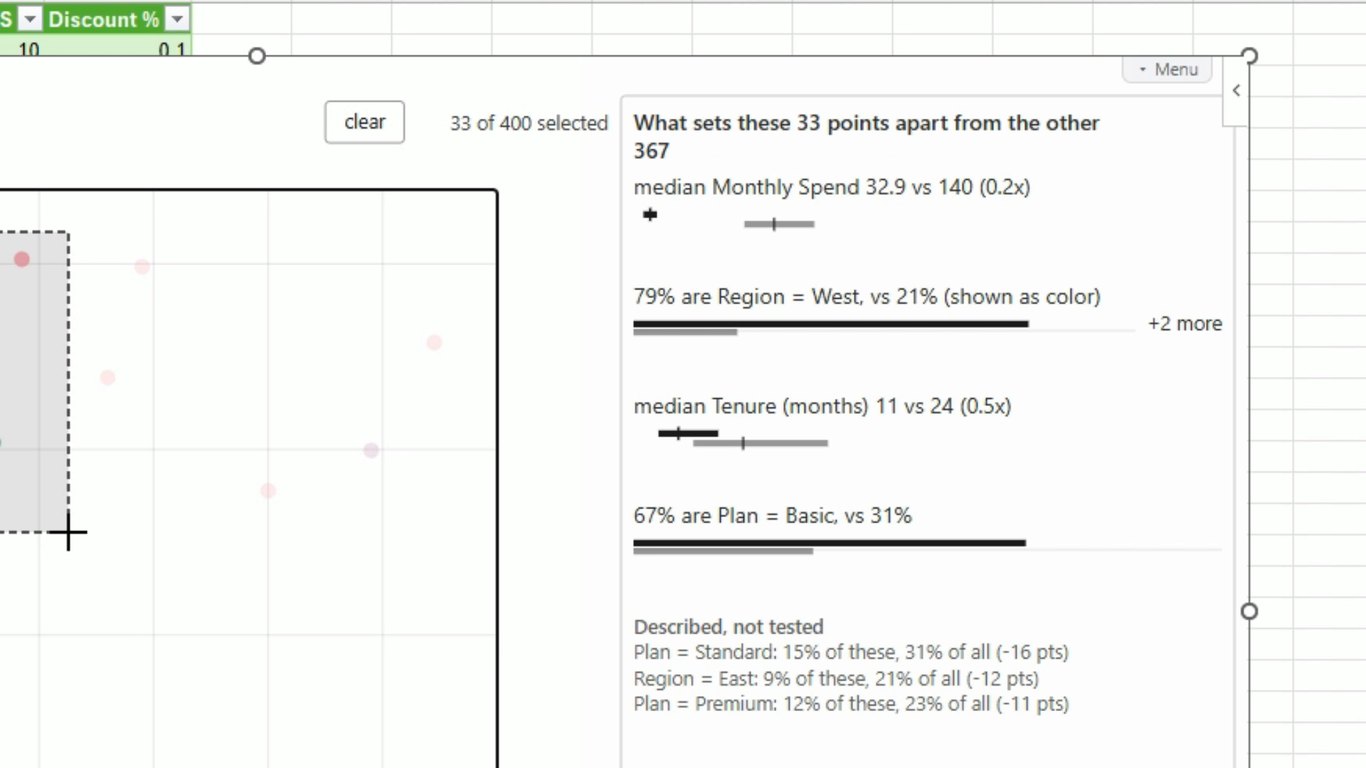
- Median monthly spend 32 vs 137 for the rest: they spend under a quarter as much.
- 78% are in the West, against 24% of everyone else. You can see it in the box: it's almost all one color.
Those are the only two findings that passed a significance test. Everything under Described, not tested (no South or Premium customers in the group, six of nine on the Basic plan, and so on) is context, not a finding. The footer says how hard it looked: 5 other fields tested; nothing else differs by more than chance. 17 comparisons, false discovery rate 5%.
Drawing a different group changes the answer, honestly. In the video I tried a few:
- 3 points, lassoed: "Field by field, with only 3 selected, a difference this size can't be told from chance." It shows the closest candidate and says it could be chance, instead of promoting it.
- 33 points, a wider box around the same corner: four findings pass now. Spend (32.9 vs 140), West (79% vs 21%), and two that nine points were too few to show: median tenure 11 months vs 24, and 67% on the Basic plan vs 31%.
- 287 points, the crowded bottom-left: spend 140 vs 116 and tenure 25 vs 16, and it says the group looks like the rest on every other field.
How it decides what's real. Each category level is tested with Fisher's exact test, and each measure with a Mann-Whitney test, which compares the two groups without assuming a bell curve. Then the Benjamini-Hochberg correction is applied across every comparison it made, which keeps the share of false findings at 5%. That correction isn't decoration. When we designed this chart we simulated it: with about 25 fields, a random lasso turns up at least one "significant" field 53 to 69% of the time if you test each field on its own. A tool that skipped the correction would hand you a confident finding most of the time, from noise.
A disclosure about this table. It's synthetic: one of our test datasets, built with a busy, low-spend, mostly-West group planted in that corner, and with Channel, NPS and Discount % filled with pure noise. We use it to check that the explainer finds the plant and doesn't promote the noise. In every selection above, no noise field passed the test.
4. The what-if predictor: what does $300,000 buy here?
The last table is 680 home listings: square footage, bedrooms, bathrooms, age, list price, neighborhood and property type. I picked What-if predictor and chose Generate. There's nothing else to set up.
It lets you test an idea against the data. Every measure gets a row with a box. Type a value into one box and that measure is pinned; every other row then shows the range it's likely to fall in for a listing like that, at the confidence you pick (80, 90 or 95%). The thin line is the range actually observed; the thick bar is the predicted range.
The usual route in Excel. LINEST gives you a regression, so the fitted value is a formula away. The
rest isn't: a range for one new listing needs a prediction interval worked out by hand; each direction
(price from size, size from price) is a separate model; and nothing warns you when the measures barely
relate and the line is fitted through noise.
What it showed. I pinned the list price at $300,000:
| Measure | Range at 90% | Center | Explained |
|---|---|---|---|
| Square footage | 662 to 1,980 | 1,320 | 58% |
| Bedrooms | about 1 to 4 | 2.6 | 0%, weak |
| Bathrooms | about 1 to 3 | 2.0 | 1%, weak |
| Age (years) | 3 to 92 | 47 | 0%, weak |
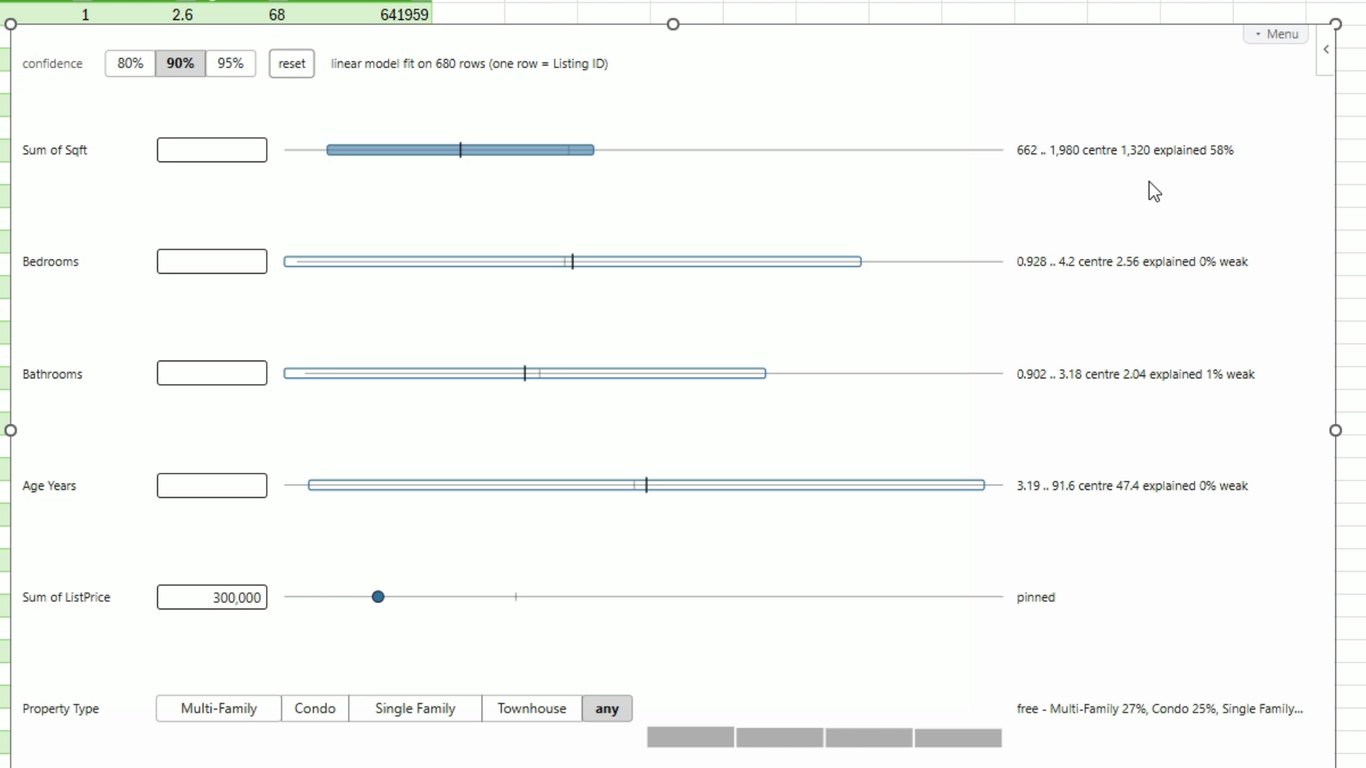
Square footage is the one that responds. Before the pin it was centered near 1,860 square feet; at $300,000 the likely range shifts down to roughly 660 to 2,000, centered on 1,320. "Explained 58%" means the pin removes 58% of square footage's spread, so that's a real signal.
Bedrooms, bathrooms and age barely move, and their bars turn hollow and say "weak". In this data, price tells you almost nothing about them. That's useful too: the tool shows you what it can't predict instead of pretending.
Then I kept going:
- $900,000: square footage moves up to 1,680 to 3,000, centered on 2,340.
- $1,200,000: 2,190 to 3,510, centered on 2,850.
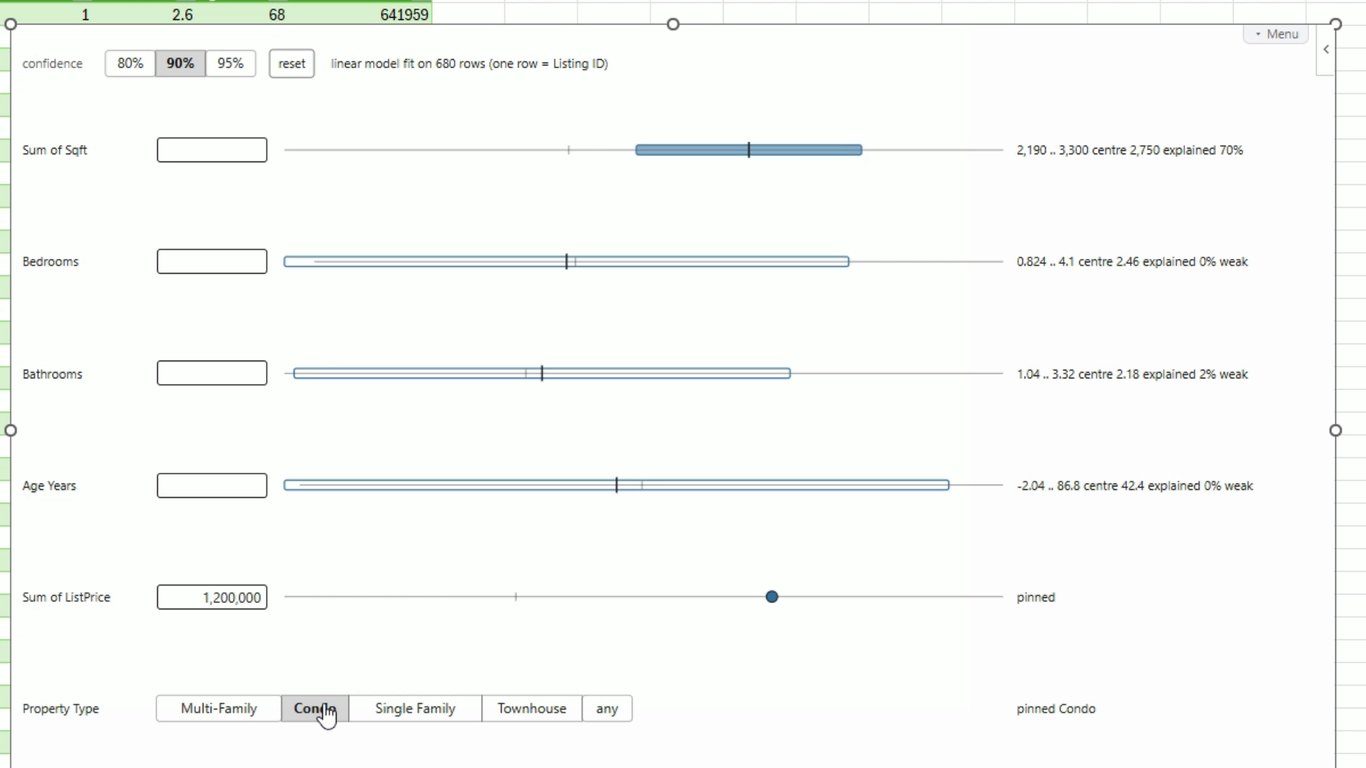
- $1,200,000 and Single Family: 2,680 to 3,800, centered on 3,240, and explained rises to 70%, because knowing the property type removes more of the spread.
- $1,200,000 and Condo: 2,190 to 3,300, centered on 2,750. Same price, same model, a smaller home.
How it works, briefly. The model is the average of each measure and how every pair of measures moves together, fit on the rows in view. Pinning some measures and predicting the rest from that one fit is the same as a regression of the free measures on the pinned ones, so one fit answers every combination of pins, in either direction: pin price and predict size, or pin size and predict price. The range is a prediction interval for one new listing, and it widens as your pins move away from typical values. It also refuses when there's nothing to model: if the measures barely move together, it says so instead of drawing ranges that only look like predictions.
It also says what it doesn't claim. The caption under the chart reads "it claims no direction": a higher price goes with a bigger home in this data, but the chart never says one causes the other.
What the three have in common
- They're apps, not pictures. You draw a selection, type a value, or click a button, and the component answers. That's what "AI Data Components" is meant to cover.
- They come with guardrails. AI can struggle with more complex widgets. Each of these starts from a design that's known to work for its shape of data, is offered only when your table fits it, and is explicit about the limits of its own answer: weak, described, not tested, can't be told from chance.
- You can still make them yours. Every one of them takes plain-English adjustments after it's built, like the shot chart did.
- The same components run everywhere RegiaBI does: in Excel, in Power BI, and through the Model Context Protocol, where an AI agent builds them into a web app (the Fabric Apps write-up is that route, start to finish).
What are you missing?
Because every component sits on the same engine and the same guardrails, adding a new one is quick: the animated treemap went from idea to the library in an afternoon, and new mini-apps keep joining the AI Gallery. So the most useful thing you can tell me is what isn't there yet.
What mini-app could you really use? A chart your data needs that nothing draws well, a map of something other tools don't map, or a small app that would replace a spreadsheet you keep rebuilding. Describe it here and it comes straight to me.
What mini-app are you missing?
Describe the chart, map or small app you'd use if it existed: what your data looks like, and what you'd want to do with it. It goes straight to the people who build these.
Questions people ask first
Does my data get sent to an AI? Your rows don't. What's sent is a profile of the table: column headers, column types, summary statistics and a few short category labels, plus anything you type into the request box. See what's sent shows the exact payload before you generate. The chart's code then runs in Excel, on your machine, against your rows. The privacy policy for the add-in has the full detail.
Can I use my own AI provider? Yes. An account can be set to use its own AI key, and the add-in then generates with it. That's set on your account page, not in the add-in.
Which versions of Excel does it work in? Excel for Windows, Excel for Mac and Excel on the web, on Microsoft 365 or Excel 2019 and later. Nothing is installed on your machine; the add-in loads from our site when the workbook opens.
What does it cost? Creating an account is free and starts a free trial (21 days as I write this), which is all this video used. After that it's a license, bought on our site rather than through Microsoft. A license covers your whole organization, not a named seat, and the same license covers the Power BI visual.
Do I need to know how to code? No. Every component is real code and it's yours: Edit the code opens it on your account page if you want to read or change it, but most charts are never opened. Plain-English requests through Adjust are the usual way to change one.
What if the result isn't what I wanted? Use Adjust and say what to change, as I did twice with the shot chart. If it's the wrong kind of chart altogether, Change type takes you back to the list with your data still connected, and nothing is spent until you press Generate.
Does it update when my data changes? Yes. Writing a component takes a few minutes, once. After that it redraws immediately when your cells change, because the code is saved in the workbook.
Can I send the workbook to someone who doesn't have the add-in? Yes. The component is saved in the file, so it draws for them with no add-in to set up, no sign-in and no credits. Whether your license is active decides only whether it carries a watermark.
Why does my table get a different list of types from yours? The list is worked out from the shape of your table: how many measures, how many categories, whether there are coordinates, dates or places. That's why the shot table got 52 and the customer table got 65. A type that isn't listed isn't a fit for that table, and the add-in won't build it.
What does "PREVIEW" next to a type mean? It's fully working and generates when you pick it. It just isn't chosen for you automatically yet, so you have to ask for it. The selection explainer and the what-if predictor were both previews when I recorded this.
Is this the same in Power BI? Yes: the same engine, the same catalog (bar a few types that need a different renderer), the same plain-English adjustments and the same account. The Power BI visual gets its data from the fields you drag in rather than from a range.
How is this different from asking a chatbot to make me a chart? A chatbot writes something new every time and leaves you to find out whether it fits your data. Here each component has a tested design, it's offered only when your table suits it, and it tells you the limits of its own answer. You still describe what you want in plain English; you just start from something that's known to work.
Try it yourself
Start with the three datasets and repeat any of these steps on the same data, then try your own.
- RegiaBI Apps, Maps and Charts for Excel: in Microsoft Marketplace, or search for RegiaBI under Add-ins in Excel.
- RegiaBI Apps, Maps and Charts for Power BI: in Microsoft Marketplace.
- Through MCP: RegiaBI Charts in the Claude directory, or
any OAuth-capable MCP client at
https://bizintelligencechampions.com/mcp. - Every component, with a dataset to try it on: the AI Gallery.
If something here doesn't behave the way I've described on your own data, tell me. That's how the next round of guardrails gets written.

Comments
No comments yet — be the first.
Leave a comment
Your email is never shown — we use it once to confirm the comment.