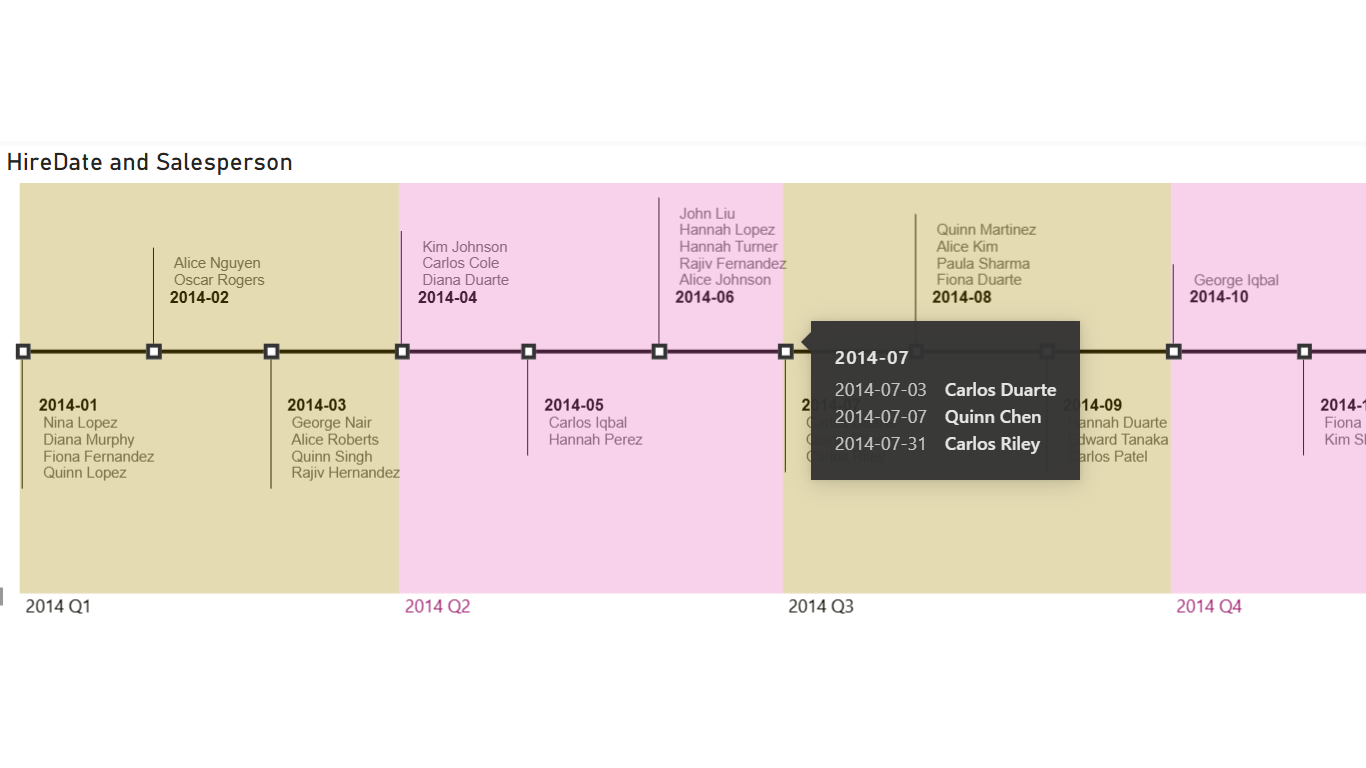
Our Visuals

The engine underneath
A chart that fits your data, first try — no charting code to learn. That is RegiaBI, and it runs outside Power BI too.
What RegiaBI doesSelect a Product:

Time-line
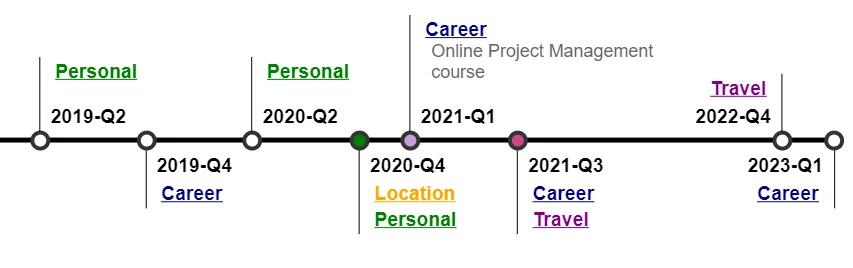
Take text event descriptions and place them on a time-line based on dates. Ability to summarize by week, month, quarter and year. Coloring, categories and embedded images are available features.
Highlights...
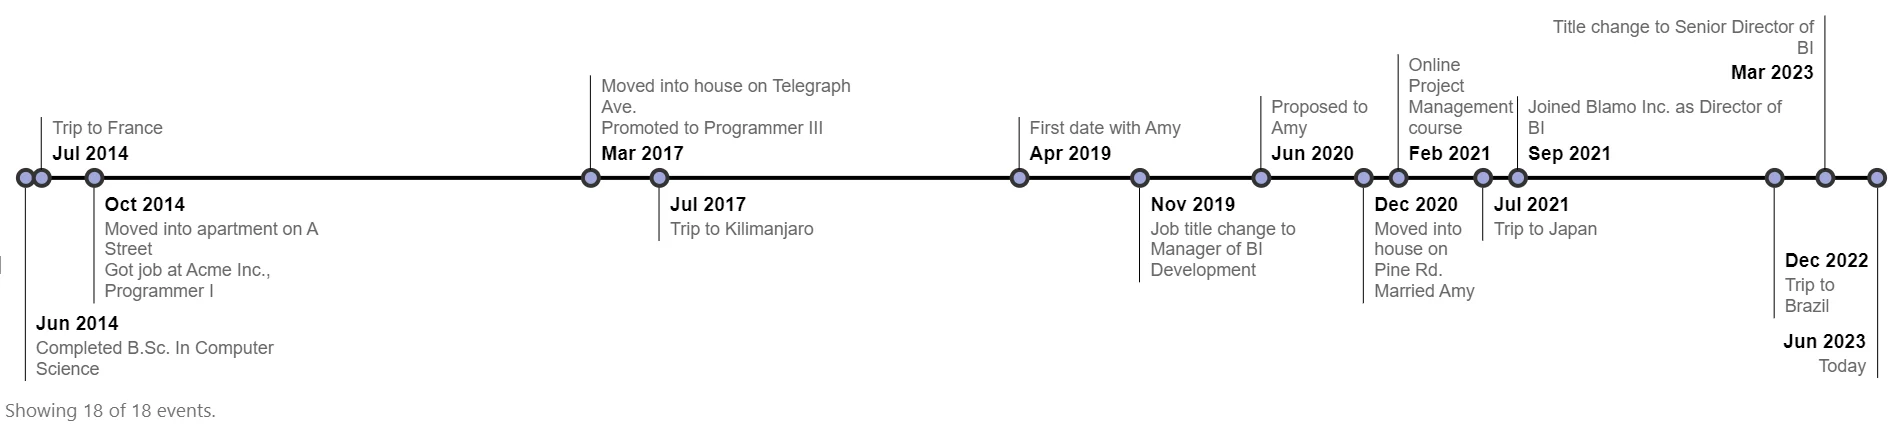
A basic configuration, with minimal effort
Colors from data, images from data
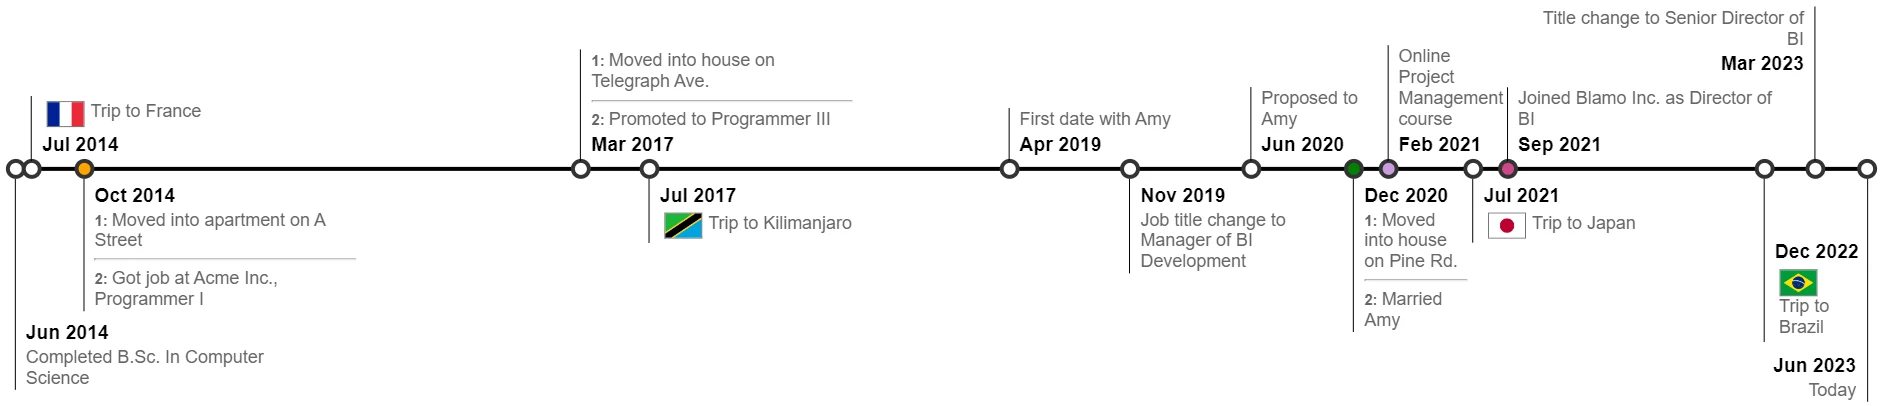
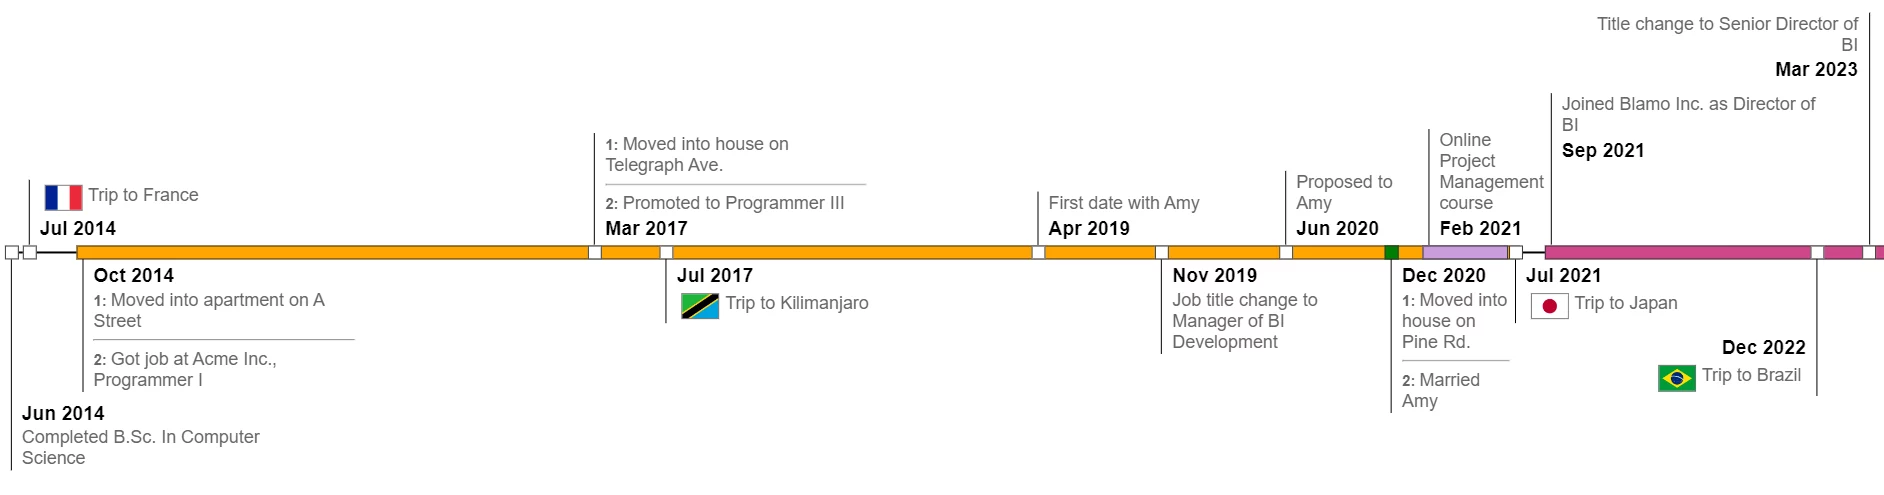
End dates, different sizes, shapes
Expandable categories, coloring from data
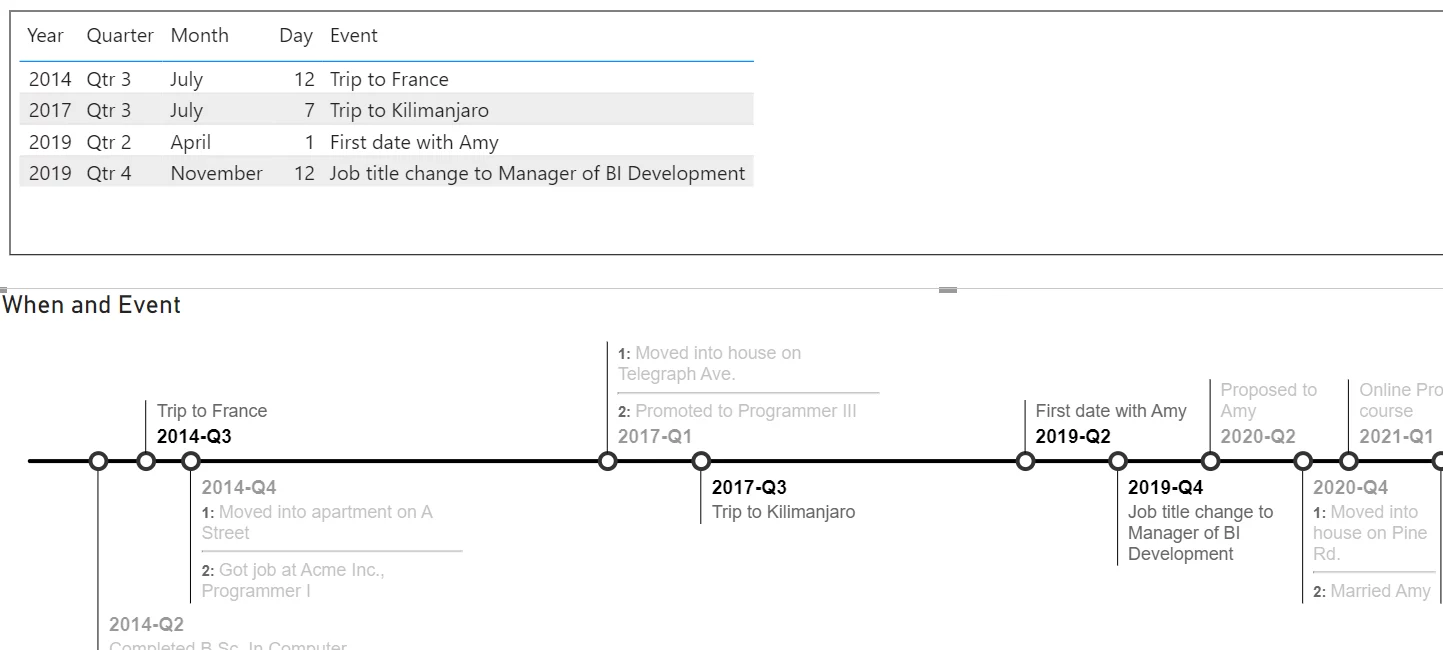
Interactive filtering
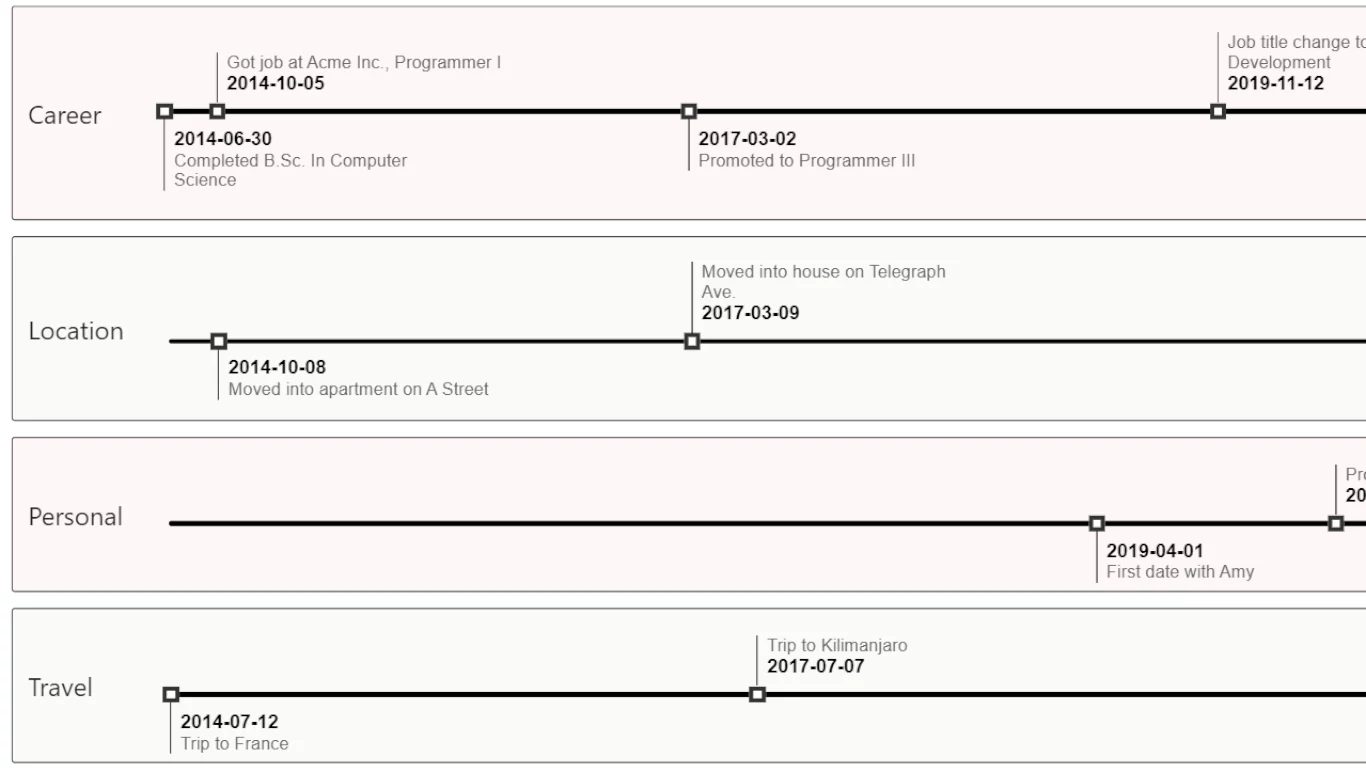
Line per Category Option
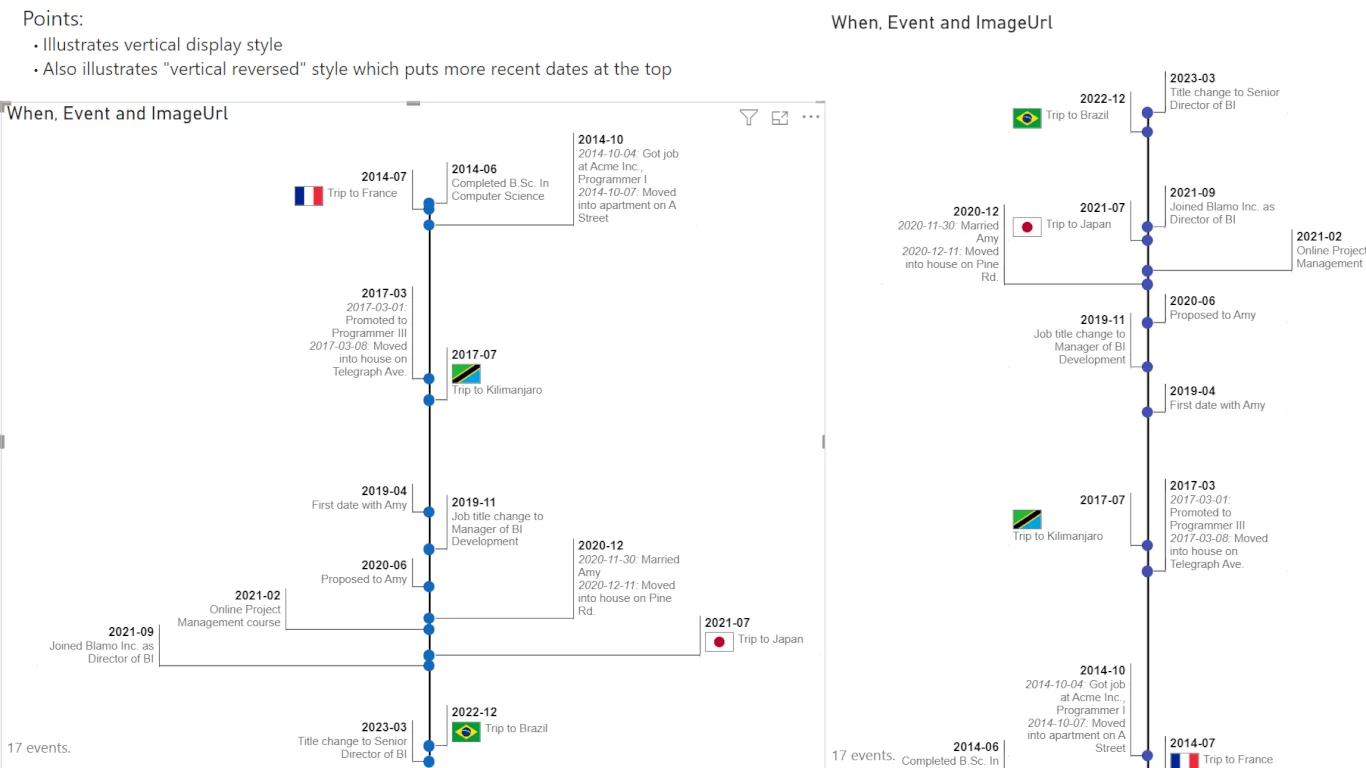
Vertical layout options, including "vertical reversed"
Optionally show ranges using configurable coloring