
Learn More...
Select a product:
Why Cluster?
Clustering is a way to group data points together based on their similarity. This can be useful for a number of reasons, such as:
- Identifying patterns in data that might not be immediately obvious.
- Reducing the number of dimensions in your data, making it easier to visualize and understand.
- Creating a new feature that can be used in other machine learning models.
The types of data that can be clustered are almost limitless. Some common examples include:
- Customer segmentation based on purchasing behavior.
- Grouping similar products together on an e-commerce website.
- Identifying different types of cancer based on gene expression data.
Clustering and Machine Learning
Clustering is a type of unsupervised machine learning, which means the algorithm tries to find patterns in the data without being given any labels. This is in contrast to supervised machine learning, where the algorithm is given a set of labeled data and tries to learn a mapping from inputs to outputs.
Features in Machine Learning
In machine learning, a feature is an individual measurable property or characteristic of a phenomenon being observed. Features are used to describe the data and are the inputs to a machine learning model. For example, in a dataset of housing prices, features might include the number of bedrooms, the square footage, and the location of the house.
Note that including features that are not relevant to the clustering process can lead to poor results. It's important to choose features that are meaningful and relevant to the problem you're trying to solve.
In the Auto-cluster visual, the first data well is where you can add one or more features from your semantic model. These can be fields or measures. All values you add are combined in what is effectively a table of data, where each row is a data point and each column is either a feature, a primary measure (data well #2), or predefined categories (data well #3).
Categorical Data
Categorical data is a type of data that can be divided into groups or categories. For example, the colors red, blue, and green are categories of the variable "color." Categorical data can be either nominal or ordinal. Nominal data has no inherent order, while ordinal data does.
The Auto-cluster visual lets you use continuous data (like numbers) and categorical data (like colors) together. More details are covered under the topic of "distance."
Medoids
A medoid is a representative object of a data set or a cluster with a data set whose average dissimilarity to all the other objects in the cluster is minimal. Medoids are similar to centroids, but are actual data points in the data set, rather than the average of the data points.
K-Medoids
K-medoids is a clustering algorithm that is similar to K-means, but uses medoids instead of centroids. The medoid is the most centrally located point in a cluster, and is the point that minimizes the average dissimilarity to all other points in the cluster. K-medoids is often used when the data is not well suited to K-means, such as when the data is non-numeric or contains outliers.
"k" is the number of clusters that the algorithm should find. The Auto-cluster visual lets you specify the number of clusters to find, or you can let the visual try to "pick k" based on heuristics.
Distance
In the context of clustering, distance is a measure of how dissimilar two data points are. There are many different ways to calculate distance, but the most common is the Euclidean distance, which is the straight-line distance between two points in a multi-dimensional space.
The Auto-cluster visual uses a distance metric that is a combination of the Euclidean distance for continuous data and the Hamming distance for categorical (nominal) data. The Hamming distance is a measure of the number of positions at which the corresponding symbols are different. Ordinal data is treated as continuous data.
Silhouette Score
The silhouette score is a measure of how similar an object is to its own cluster (cohesion) compared to other clusters (separation). The silhouette score used by the Auto-cluster visual is a "simplified" version that performs well, and ranges from 0 to 1, where a high value indicates that the object is well matched to its own cluster and poorly matched to neighboring clusters.
Normalized Dimensions
Normalization in the context of the Auto-cluster visual is the process of scaling individual features to be on a range of 0 to 1. This can be useful because features with larger scales can dominate the clustering process, leading to biased results. Normalizing the features ensures that each feature contributes equally to the clustering process.
Another way to think about normalization is to consider the "distance" between two points. If one feature has a range of 0 to 100, and another has a range of 0 to 1, the first feature will dominate the distance calculation. Normalizing the features ensures that each feature contributes equally to the distance calculation.
The Auto-cluster visual lets you choose whether or not to normalize the features you add to the first data well. By default, normalization is turned off.
It's possible to normalize all features to the same range (0-1), or to normalize each feature to its own range (0-n). The latter is useful if you want to give more importance to certain features than others. You can even eliminate some features from being used in the clustering process, by setting their weighting to zero - while still retaining them as part of the underlying tabular set of data points.
Grouping Levels
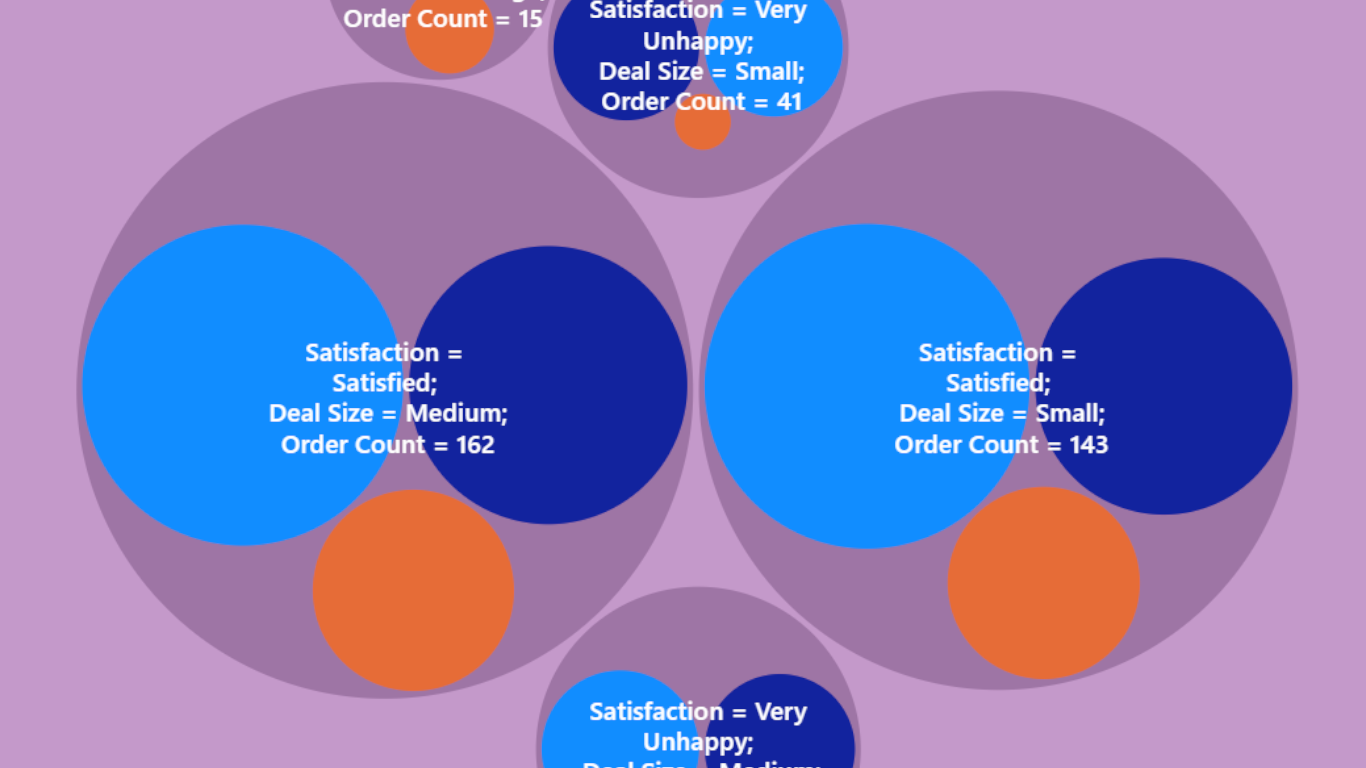
You can nest levels of grouping which can be used to show hierarchical relationships. If you do not include any fields in the "Predefined Categories" data well, you would expect to see two sets of nested circles, if using the circle packing view: the outermost for the derived cluster, the innermost for each data point.
Each field you add to the "Predefined Categories" data well becomes another set of circles. The order from the data well is honored. You can control at what level the derived cluster is shown using the "Cluster Position" setting. "Cluster Position" is a whole number (default 1), which represents the position number at which to show the derived clusters. ("1" is the top-level spot, "2" is the next level down, etc.)
"Solution Finder"
The Auto-cluster visual has a "Solution Finder" feature that can help you find the best clustering solution for your data. The Solution Finder uses a genetic algorithm to search for the best number of clusters and/or the best feature weights for your data. This enables a way to experiment with changing your selection of features, to see what is truly more important in the clustering process.