
Our Visuals

The engine underneath
A chart that fits your data, first try — no charting code to learn. That is RegiaBI, and it runs outside Power BI too.
What RegiaBI doesWe create and publish educational videos on our YouTube channel that explore not only our visuals but also the Power BI platform itself. Subscribe to our channel to stay updated!
Featured videos:
LLM AI Charts. In our primary example, we build a zoomable candlestick chart for a hypothetical stock, including moving average lines. (3:52)
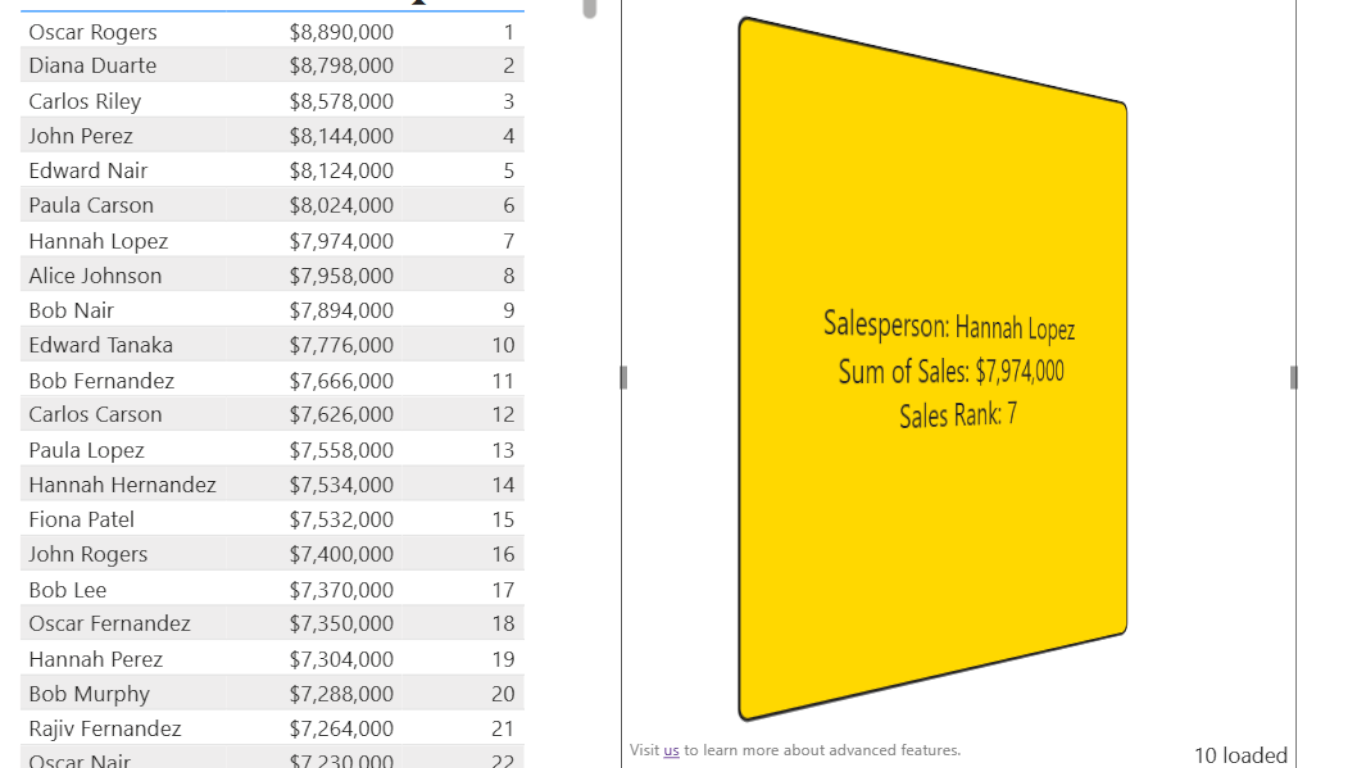
Multiformat / Animations Card. Learn how to use transitions to create dynamic cards that cycle through different values, using effects.
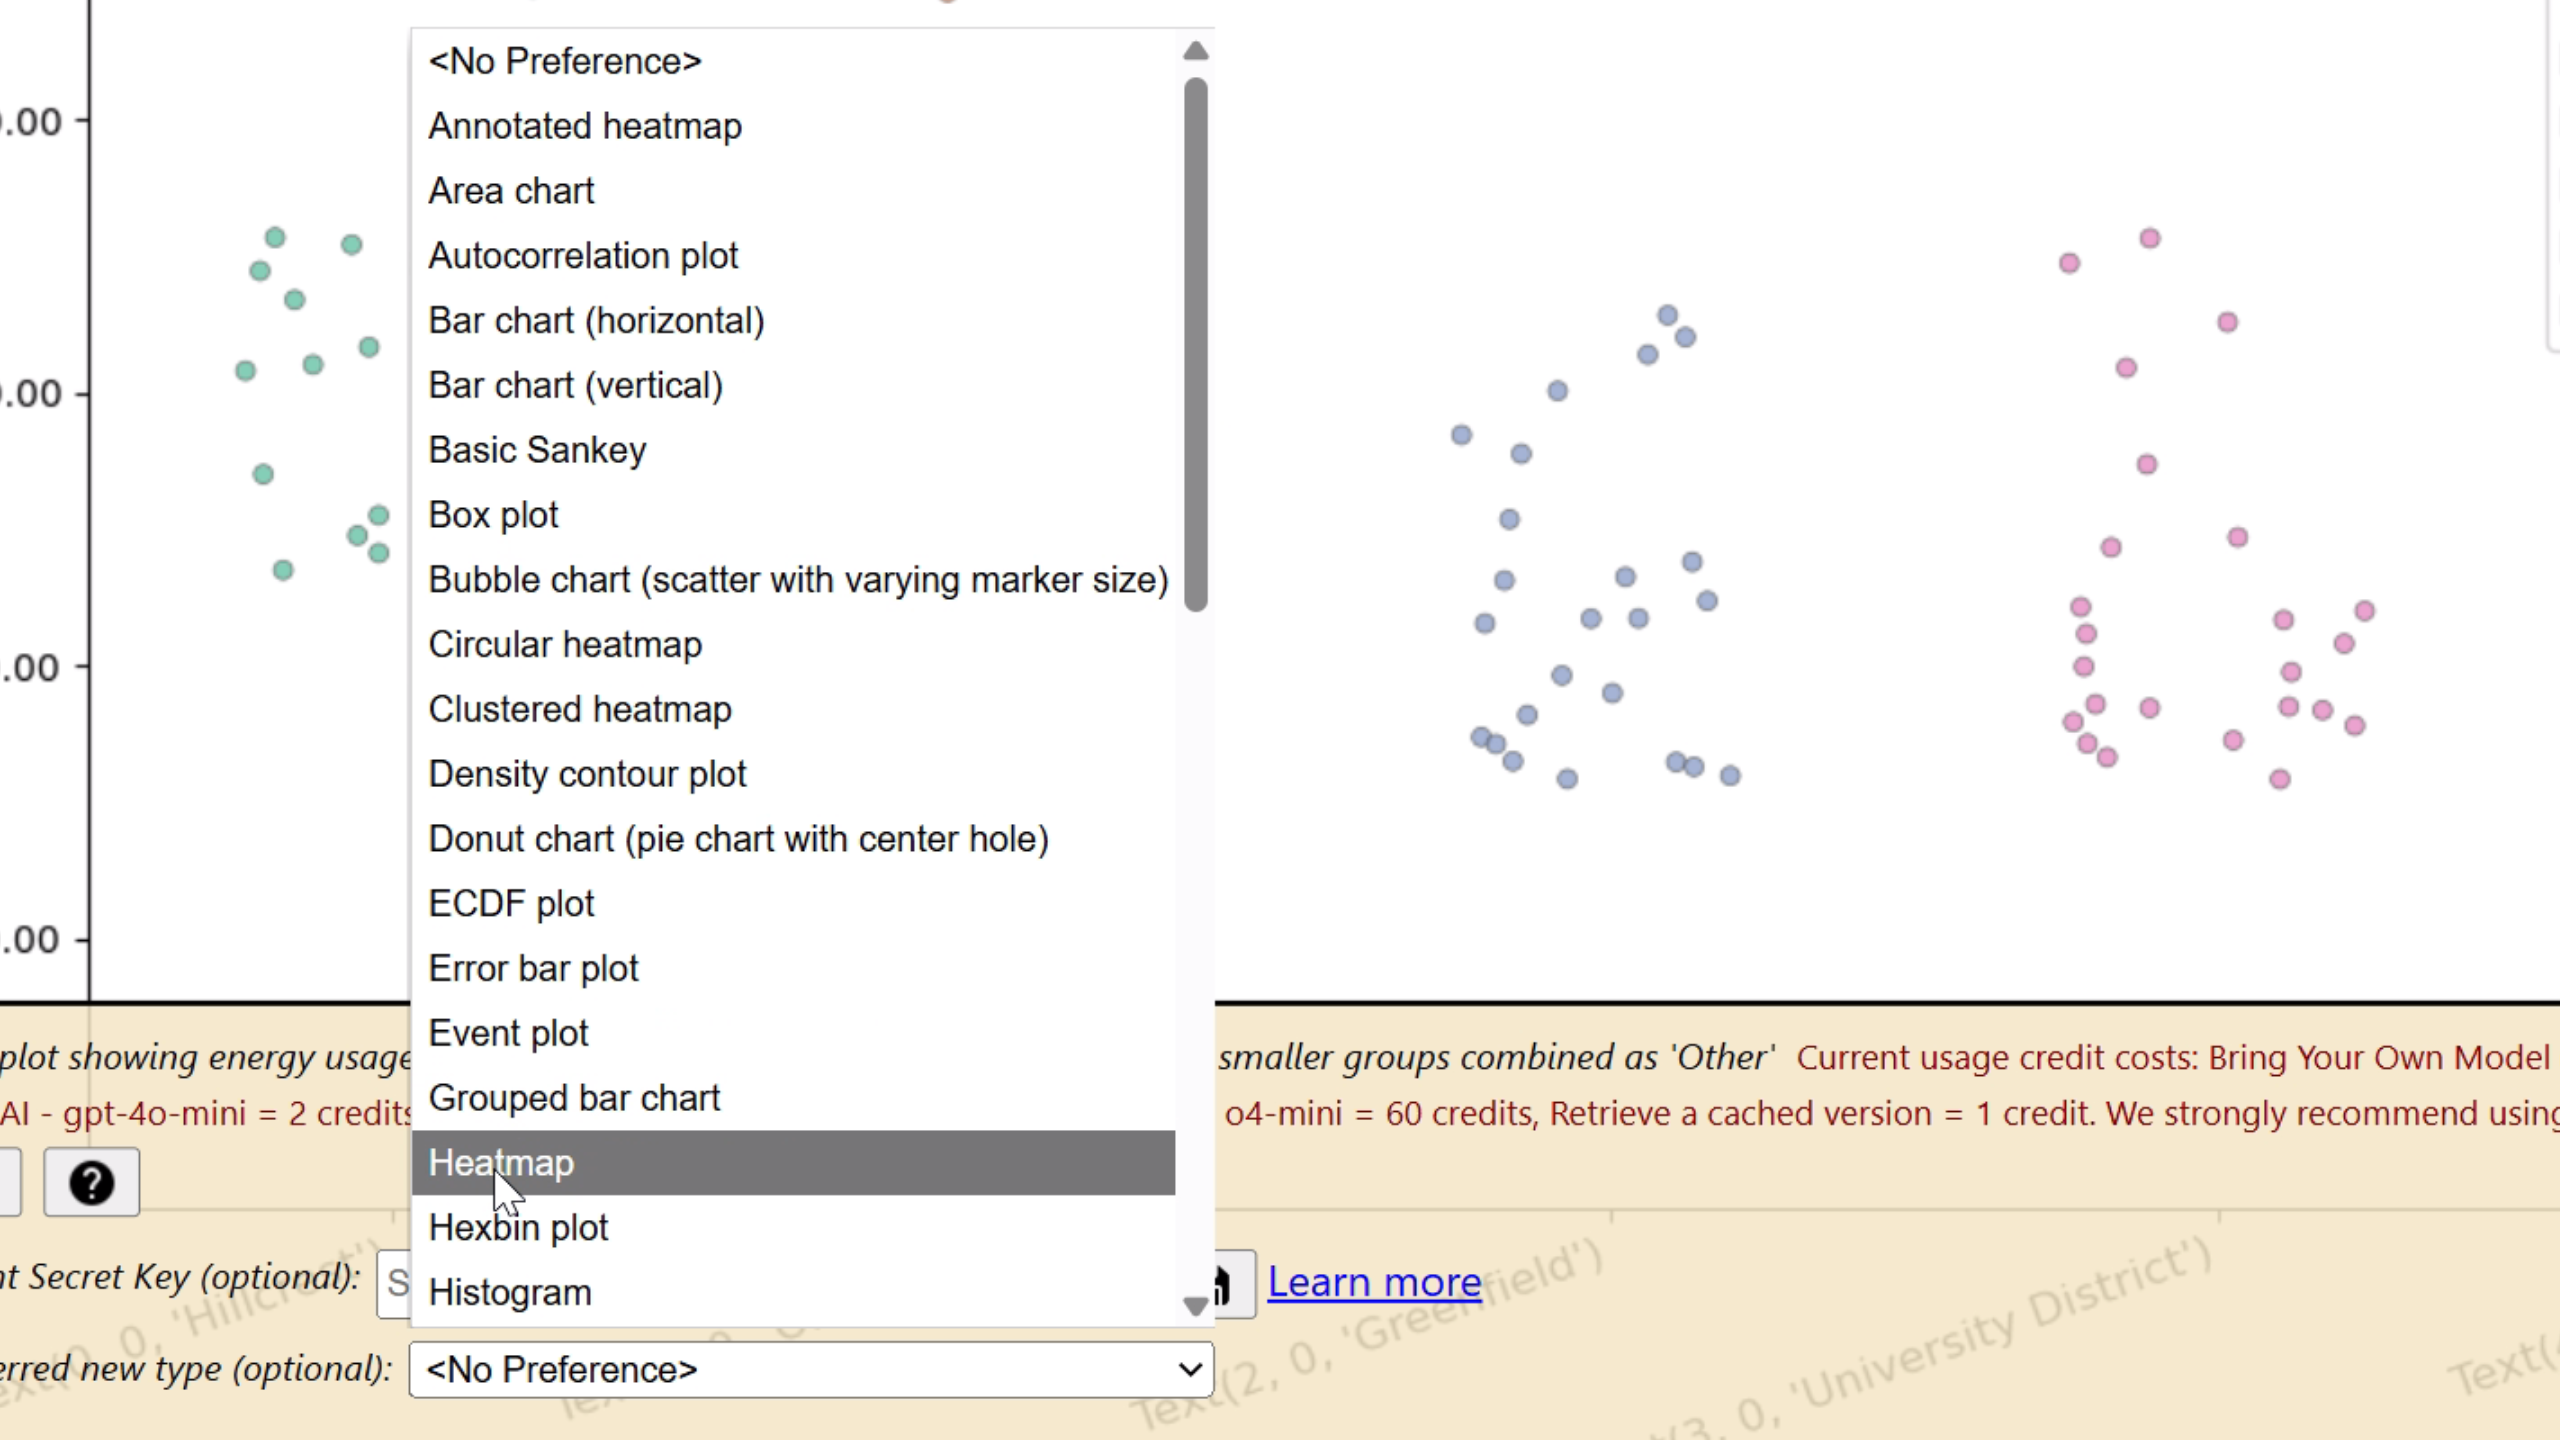
LLM AI Charts. We build a heatmap using iteration, including rules that we invent on the spot! (3:34)